What we're trying to do
FramingScientists at the Janelia Research Campus mapped every neuron and every connection in a fruit fly's ventral nerve cord — the part of the nervous system that controls walking. This dataset is called the MANC connectome (~23,000 neurons, 1.2 million synaptic connections; Takemura et al. 2024).
We take this wiring diagram, simulate the neurons it describes, connect them to a physics-based virtual fly body, and ask one question.
This is a test of whether the connectivity itself encodes locomotion, without any machine learning to fill in the gaps. If it works, it tells us something fundamental about how nervous systems produce behavior.
Connectome: Takemura et al. 2024. Fly body model: Vaxenburg et al. 2025, Nature.
Why we think it's possible
FramingDeepMind showed that a reinforcement learning (RL) policy — a small neural network trained with reward signals on 13,000 video snippets of real fruit flies walking — can make this exact same virtual fly body walk realistically (Vaxenburg et al. 2025, Nature).
This proves the virtual body can walk. The physics are good enough. The question is whether the real connectome — not a trained neural network — can drive it.
We use DeepMind's RL policy as a reference target: it tells us exactly what "good walking" looks like in this physics model. Our goal is to produce the same behavior, driven by the real connectome instead of machine learning.
RL reference: Vaxenburg et al. 2025, Nature. Stride frequency matches Mendes et al. 2013, eLife.
Our strategy and tools
FramingThe neural side
We simulate the connectome's neurons using Brian2, a spiking neural network simulator. Each neuron has a membrane potential, receives synaptic input from other neurons, and fires electrical spikes — just like real neurons. The connection strengths (who connects to whom, and how strongly) come directly from the MANC synapse counts.
The body side
MuJoCo simulates the fly's physical body: 78 motors (called actuators) that move joints, realistic gravity, ground contact forces, and leg adhesion. An actuator is like a tiny electric motor at each joint — it receives a command between −1 and +1 and pushes the joint accordingly.
The closed loop
The brain drives the body; the body's sensors (joint angles, ground contact, forces) feed back to the brain. This cycle runs at 0.1 ms physics timesteps for 3 seconds of simulated time.
How we measure progress
WQS (Walking Quality Score): 13 binary pass/fail metrics checking whether the fly walks like a real fly. Each metric has a threshold derived from real Drosophila walking data. Includes stride regularity, body stability, ground contact, body elevation, leg support, and more. A score of 13/13 means every aspect of walking meets the biological threshold.
JTF (Joint Trajectory Fidelity): 48 continuous correlation values — one for each joint (degree of freedom). For each joint, we compute the Pearson correlation between our fly's angle over time and the RL reference's angle over time. +1.0 = perfect match, 0 = uncorrelated, −1.0 = moving opposite. JTF is much harder to "game" than WQS because it tracks every joint individually.
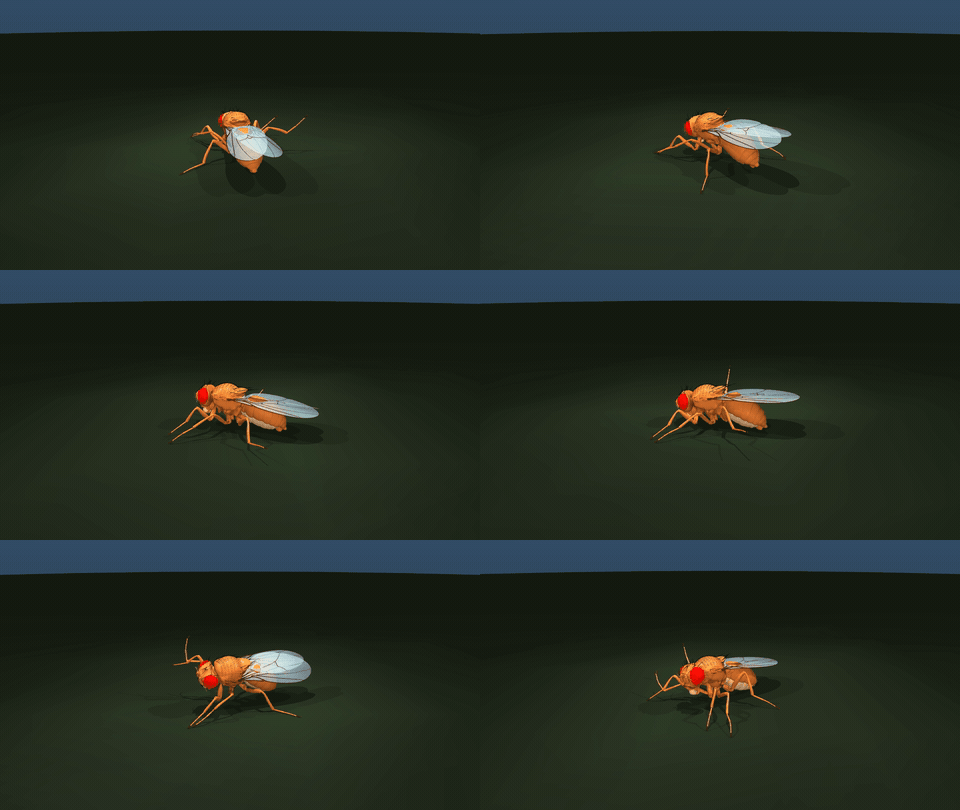
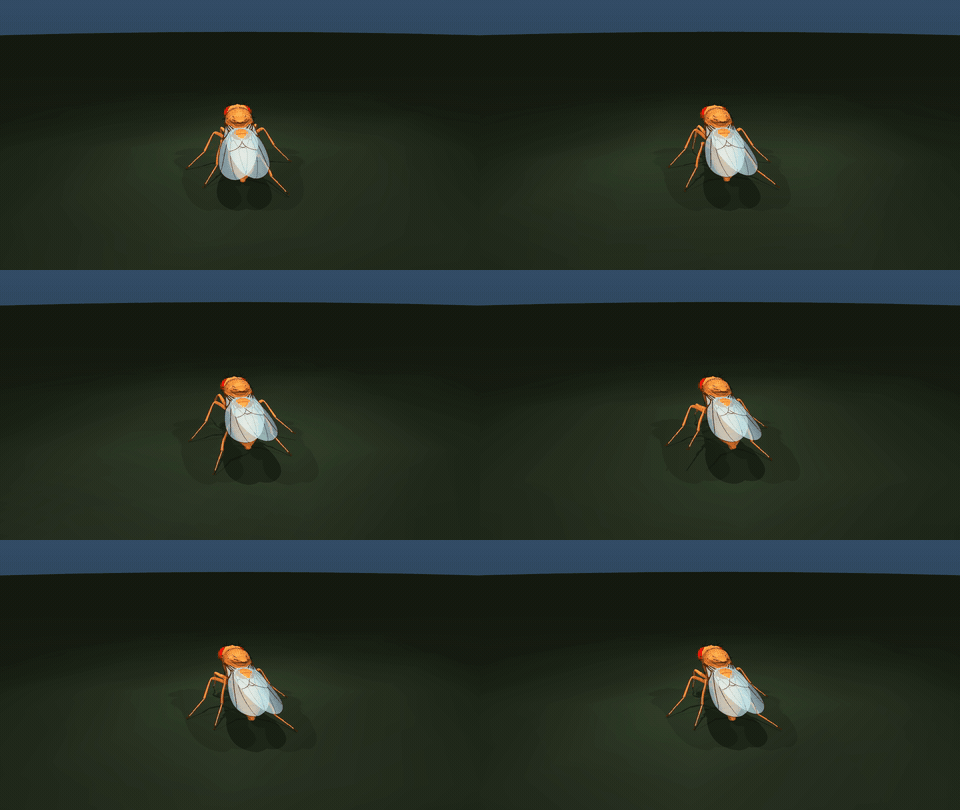
Video validation: We learned that aggregate scores like WQS can be misleading — a fly can pass many checks while still belly-sliding on the ground. We always render lateral and dorsal videos to visually confirm results.
The RL reference: our calibration target
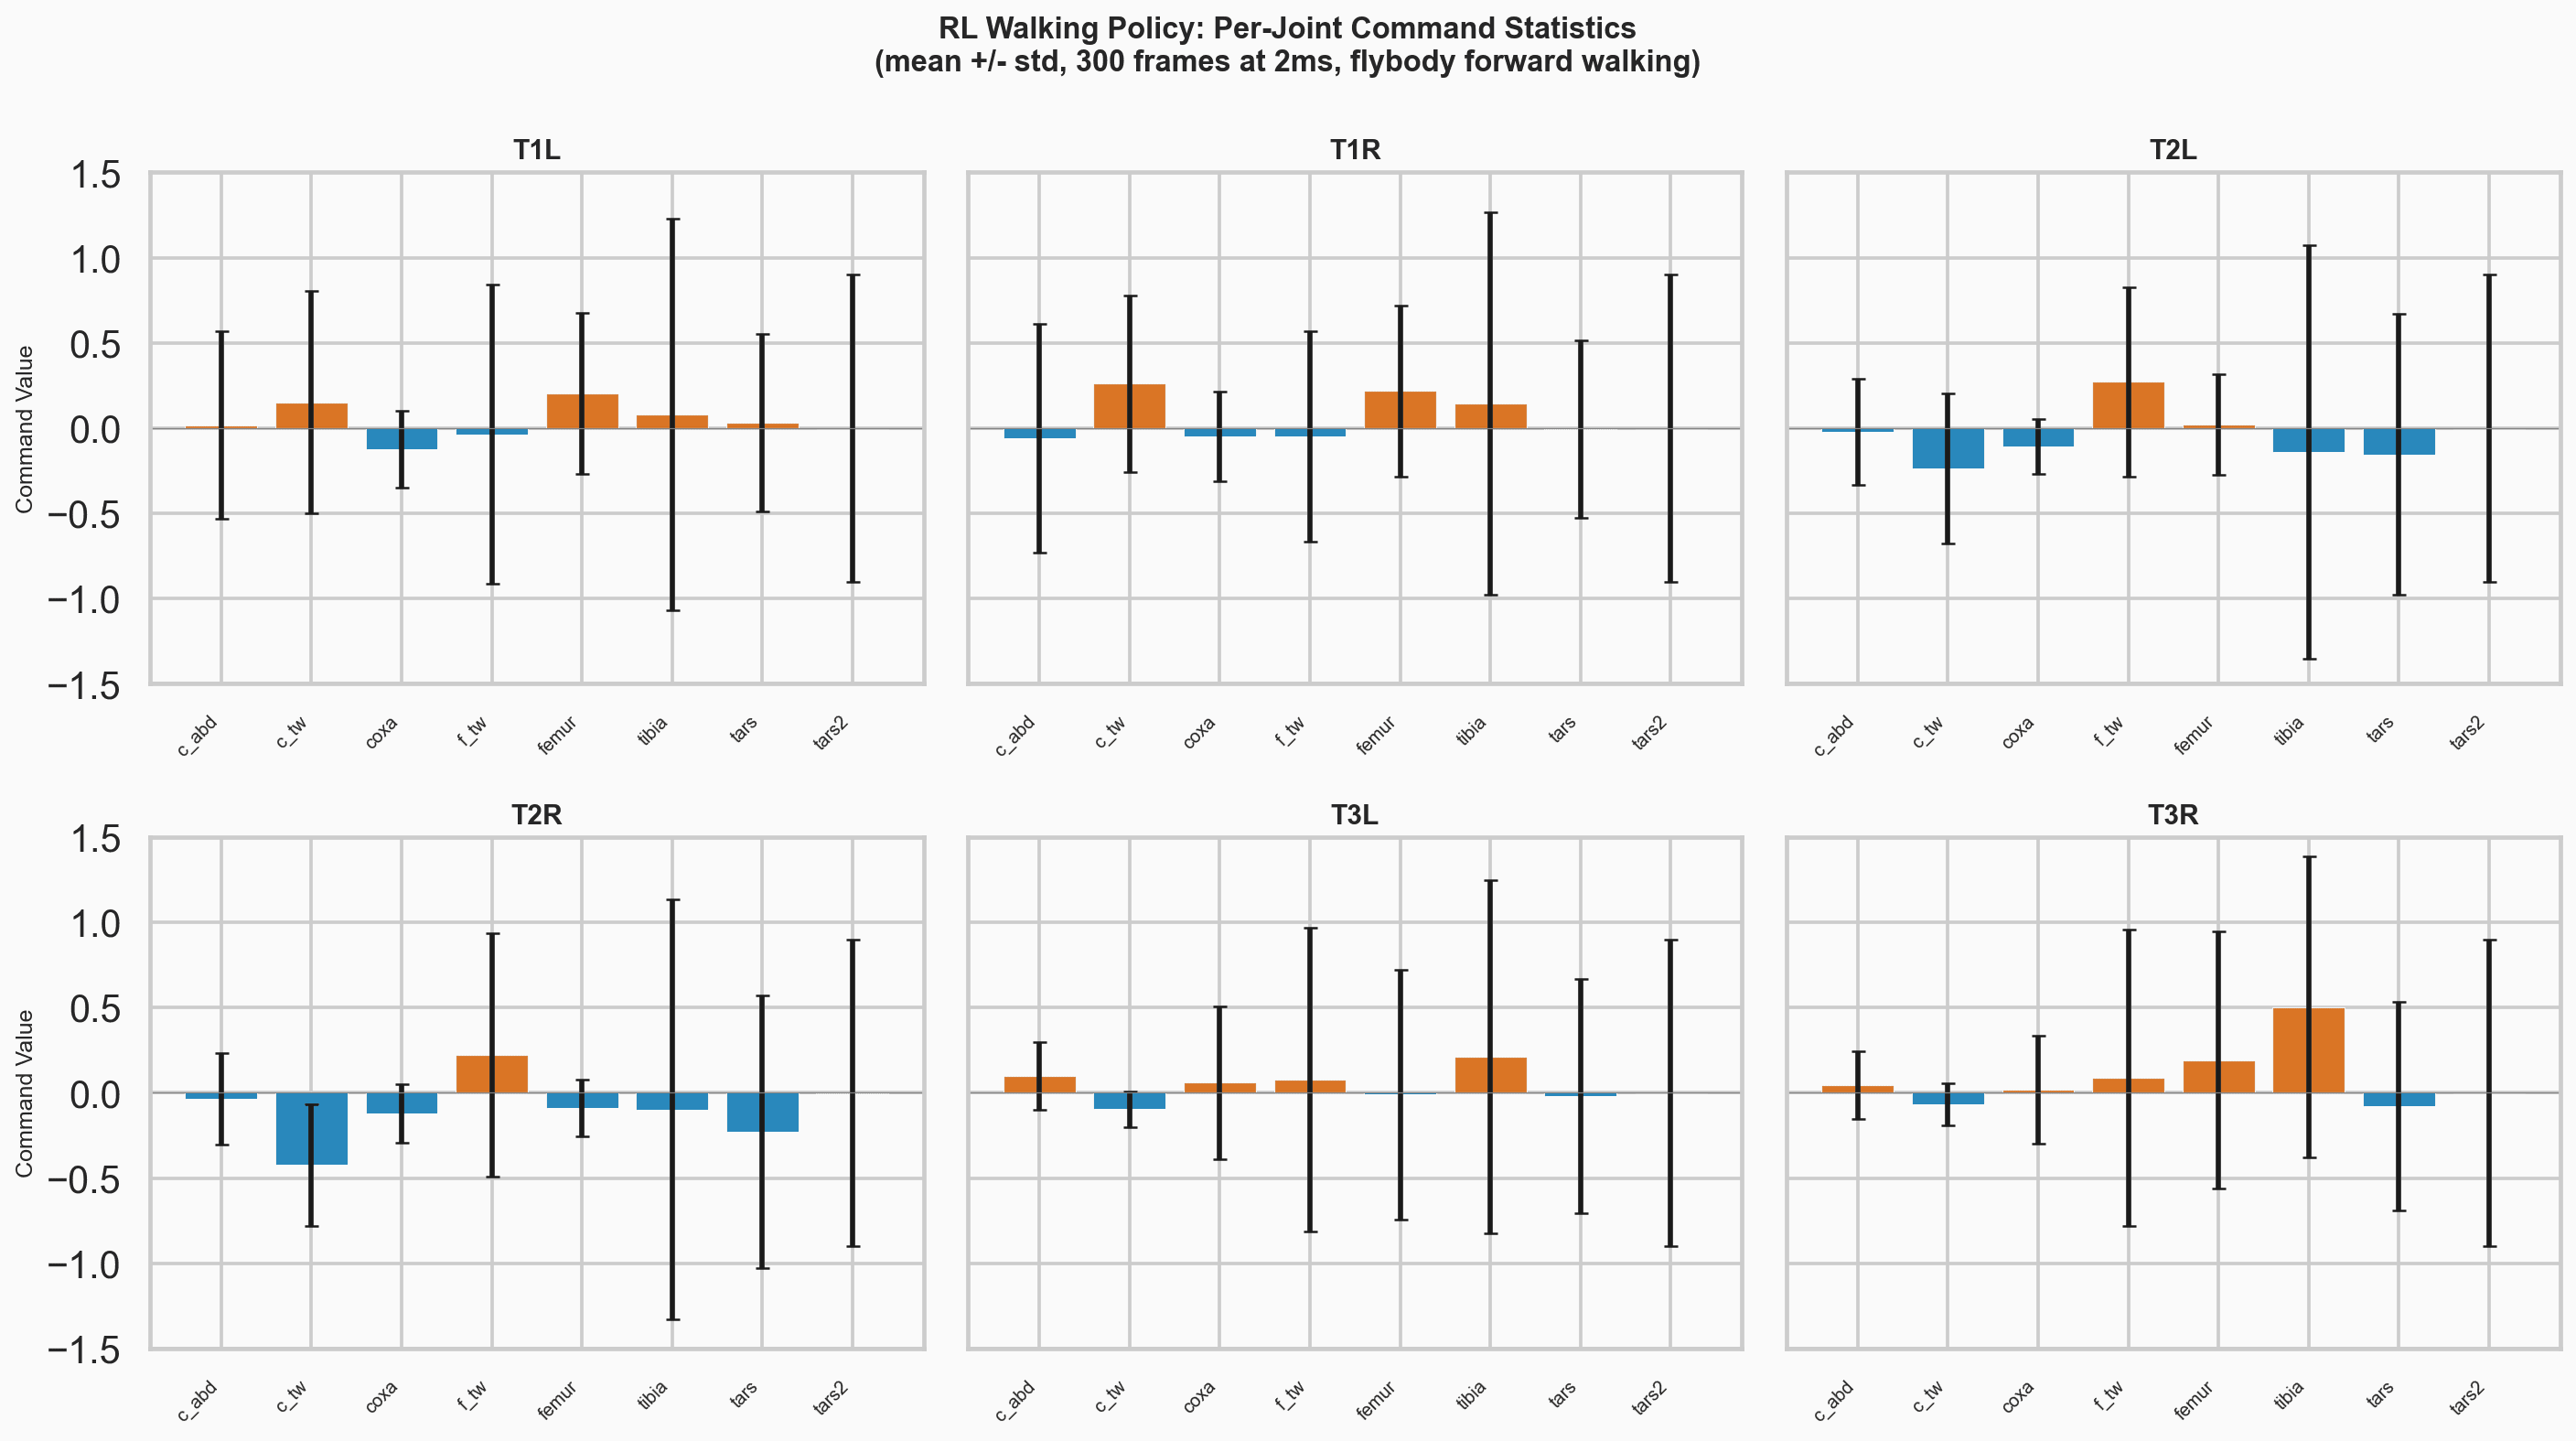
FramingDeepMind's RL walking policy (Vaxenburg et al. 2025) defines what "correct walking" looks like in our physics model. We replayed it, scored it, and extracted per-joint angle profiles as calibration targets.
RL walking profile
| WQS v2 | 12/13 (fails stride length only) |
| JTF | 1.0 (by definition — it's the reference) |
| Stride frequency | 7.8 Hz (matches Mendes 2013) |
| Forward speed | 0.862 cm/s |
| Duty factor | 0.663 (66% of time in stance) |
| Body height CV | 0.016 (very stable) |
| Body elevation | 1.033× resting height |
Physics timestep note
DeepMind trained at a 200 µs timestep; we run at 100 µs. Both score 12/13 WQS but different metrics fail. Our connectome fly also runs at 100 µs, so targets are internally consistent. Full discrepancy analysis: WASD_RL_DISCREPANCIES.md.
What the literature says about insect walking
FramingThe insect locomotion literature frames three competing explanations for how the nervous system generates walking. Our experiments test these with real connectome data.
H1 — Central Pattern Generator (CPG) drive
Specialized "CPG" neurons in the nerve cord spontaneously oscillate back and forth, generating the walking rhythm internally. Sensory feedback fine-tunes the timing but is not required to start the rhythm.
Pearson 1993, Ann Rev Neurosci; Wilson 1961, J Exp Biol (locust flight)H2 — Sensory feedback loop (reflexive walking)
CPG neurons provide a steady "gas pedal" drive, but the actual step-by-step walking pattern emerges from the fly's legs touching the ground, bending at joints, and that sensory information feeding back to the nervous system. The rhythm lives in the loop, not in individual neurons.
Büschges & Ache 2024, Physiol Rev 105:975; Büschges 2005; Bässler 1993, Brain Res Rev; Mendes et al. 2013, eLifeH3 — Biomechanical contribution
The body itself does part of the work. Leg mechanics, passive joint compliance, and ground contact forces create coordination patterns. Neural complexity may be less important than getting the body geometry right.
Full & Koditschek 1999; Pugliese et al. 2025 (no inter-leg coordination from CPG alone)The journey: four research eras
Framing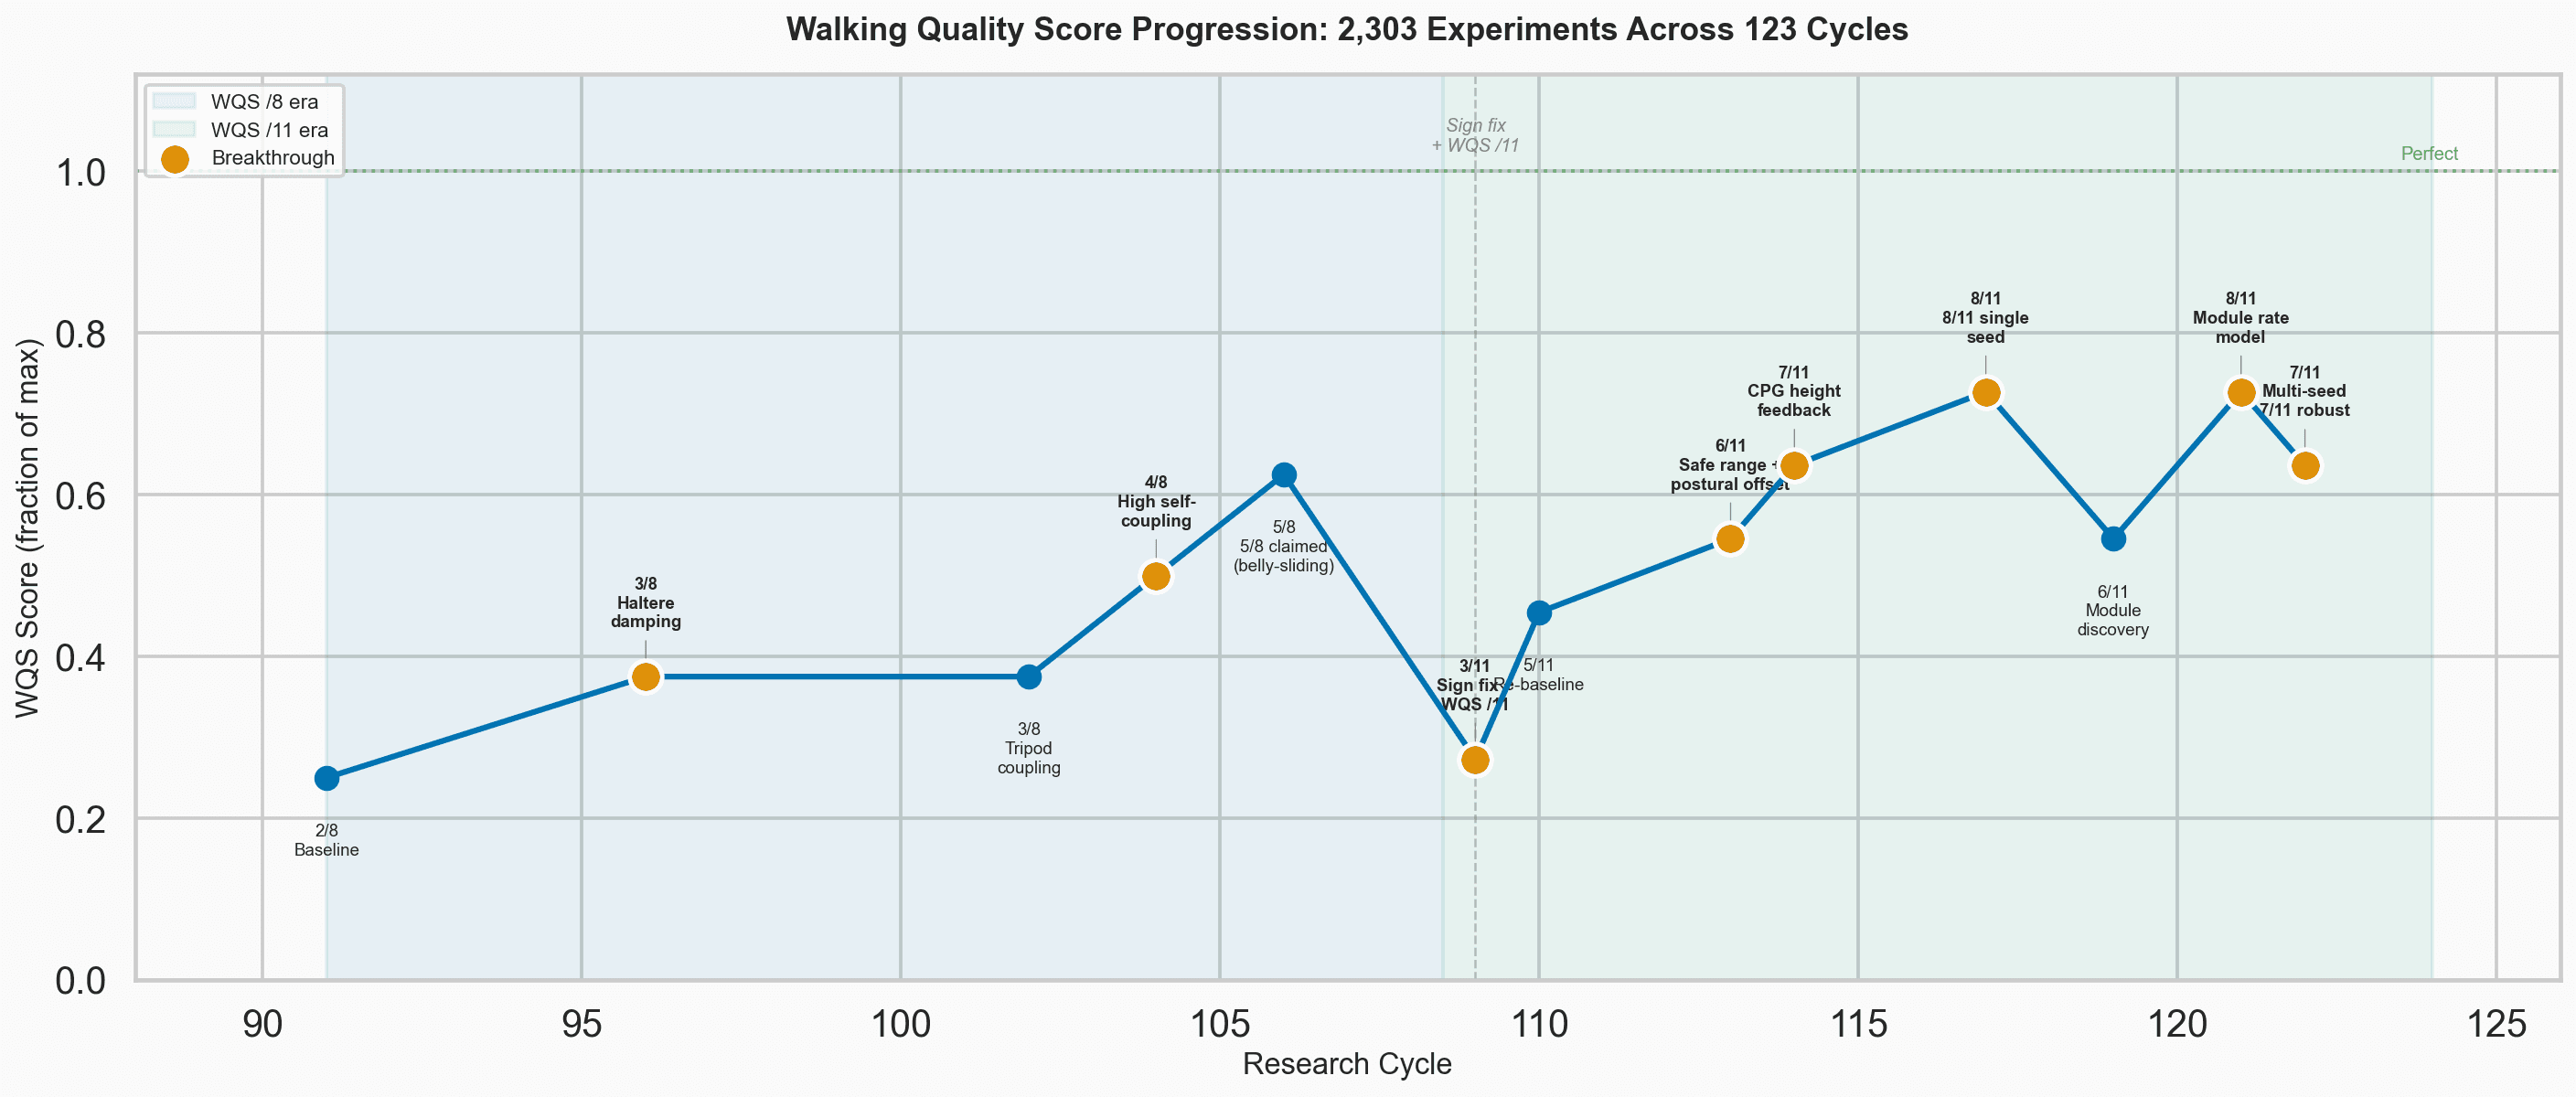
| Era | Cycles | Experiments | What it established |
|---|---|---|---|
| Era 1 — numpy rate model | C40–C134 | 3,559 | Foundational mechanisms. WQS 2/8 → 10/13. |
| Era 2 — spiking neurons | C135–C136 | 50 | CPG can't oscillate alone. |
| Era 3 — real MANC pathways | C137–C147 | 2,491 | Per-joint UBGs. Proxy elimination. JTF 0 → 0.081. |
| Era 4a — standing first | C148–C157 | 1,288 | HH motor neurons. Neural standing. |
| Era 4b/4c — per-muscle | C158–C181 | 3,400+ | Hill muscles. Basin bifurcation. The open-loop ceiling. |
Building the system
Pre-era · D1–D3, W1–W106Before the systematic walking experiments began, we built the entire simulation infrastructure from scratch and ran the first embodied neural simulations.
D1–D2: infrastructure
- Built the FES v1.0 experiment specification format (JSON-serializable, simulator-agnostic)
- Brian2 adapter layer for spiking simulation
- Golden regression tests to prevent silent breakage
- Next.js + Babylon.js web frontend for experiment visualization
- FastAPI backend deployed on AWS ECS
D3: first embodied simulation
- Connected the connectome to the MuJoCo fly body for the first time
- Proved CPG anti-phase oscillation (cross-correlation = −0.83 with AdEx neurons)
- Discovered T3 leg contralateral alternation from proprioceptive feedback
- Achieved template-free locomotion at 4.33 cm/s (no RL assistance)
D3 phases 9–12: the motor pipeline crisis
- Motor neuron firing rates: 0.47 Hz (biological: 30–200 Hz) — far too slow to generate meaningful joint torques
- Motor commands 8.5× too weak to close the sensorimotor loop
- Spike-to-command pipeline destroying phase timing information
- Solution: using CPG phase to select between gait templates (not modulate amplitude) produced visible stepping with tripod timing
Building the pipeline: eight foundational mechanisms
Era 1 · C40–C134Producing coordinated locomotion required solving eight problems in sequence. Each mechanism models something real in fly biology — nothing is engineered ad hoc. These form the foundation that all later experiments build on.
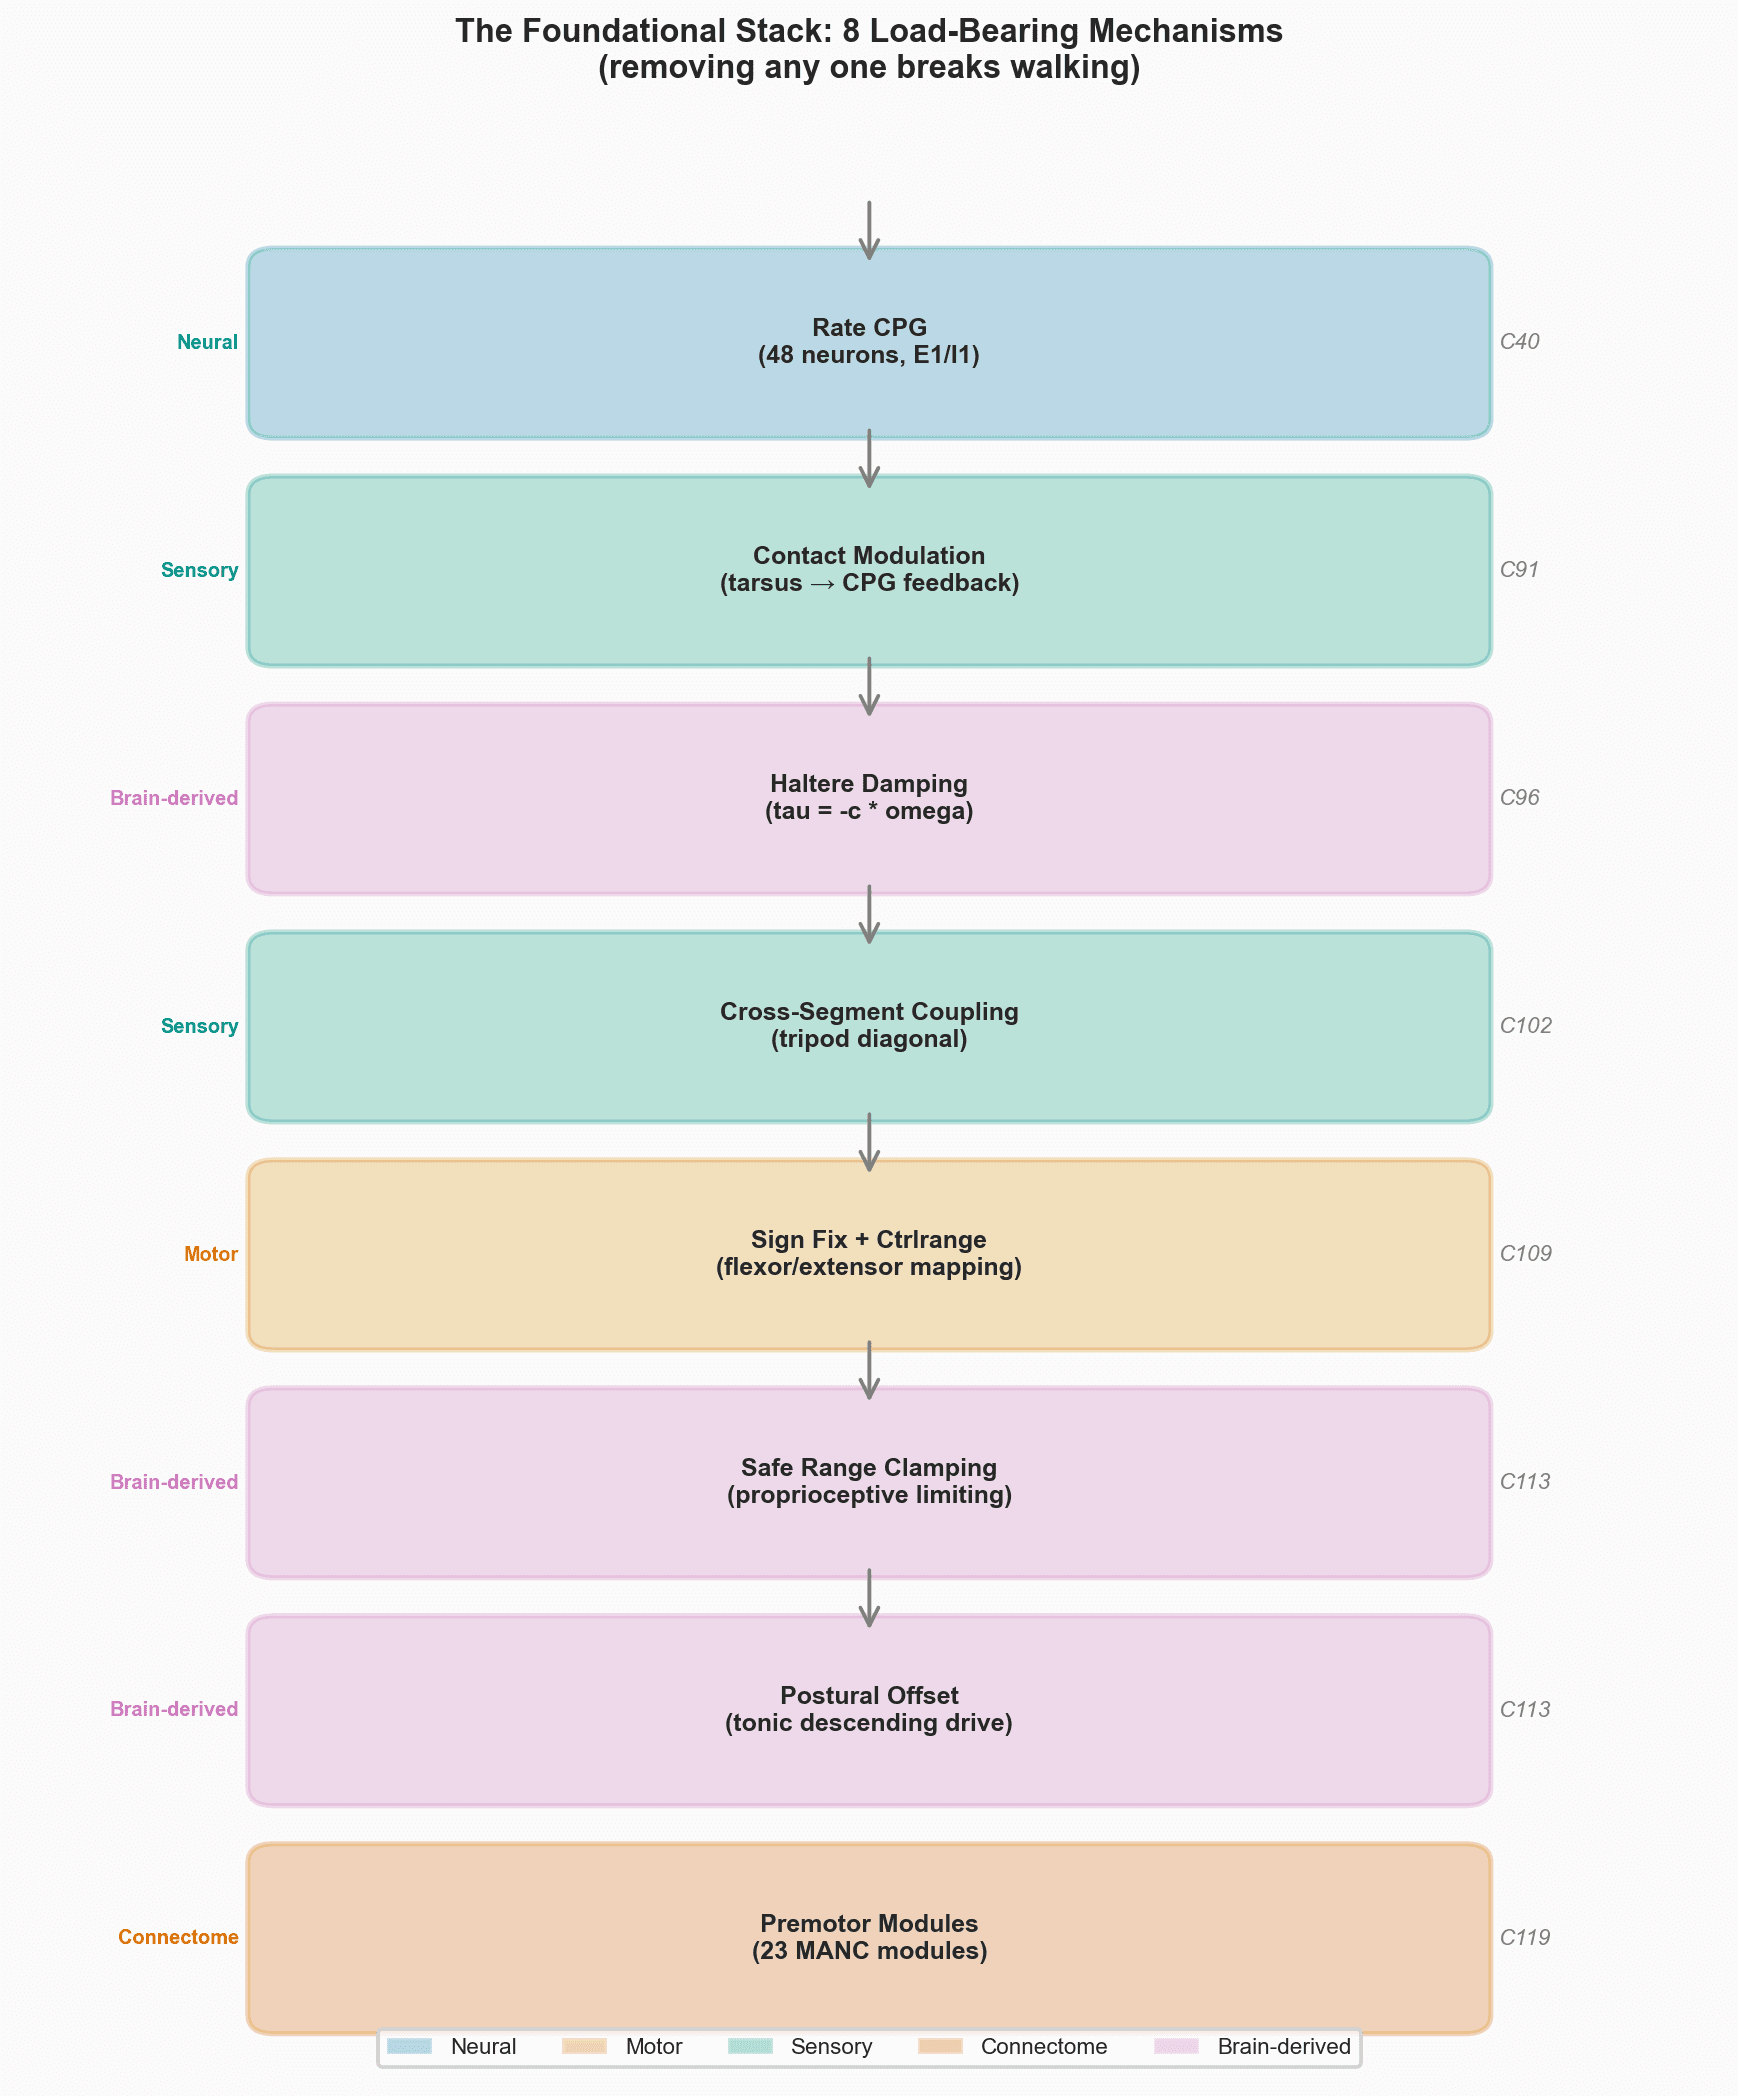
- CPG oscillator — two neuron groups (E1 excitatory, I1 inhibitory) alternate, creating a basic rhythmic signal for each leg (Pearson 1993).
- Motor sign fix — flexor muscles must push opposite to extensors. 1,353 experiments ran with this broken.
- Actuator range calibration — each joint has different physical limits. Without calibration, 40–60% of the joint's range of motion was unused.
- Safe range clamping — T2 femur at full extension produces catastrophic downward force. Real flies have reflexes that prevent this (Zill et al. 2004).
- Postural offset — the fly must stand before it can step. Per-joint tonic signals shift resting posture (Bidaye et al. 2014).
- Haltere damping — gyroscope-like organs stabilize the body during locomotion (Pringle 1948; Dickinson 1999).
- Premotor modules — real intermediate neurons between CPG and muscles broke a speed ceiling (Lesser et al. 2024).
- Geometry corrections — driving legs toward mechanically efficient postures during stance, modeling passive joint mechanics.
Removing any one of these collapses the fly's locomotion — the system only produces forward motion with all eight in place.
Half the muscles were broken
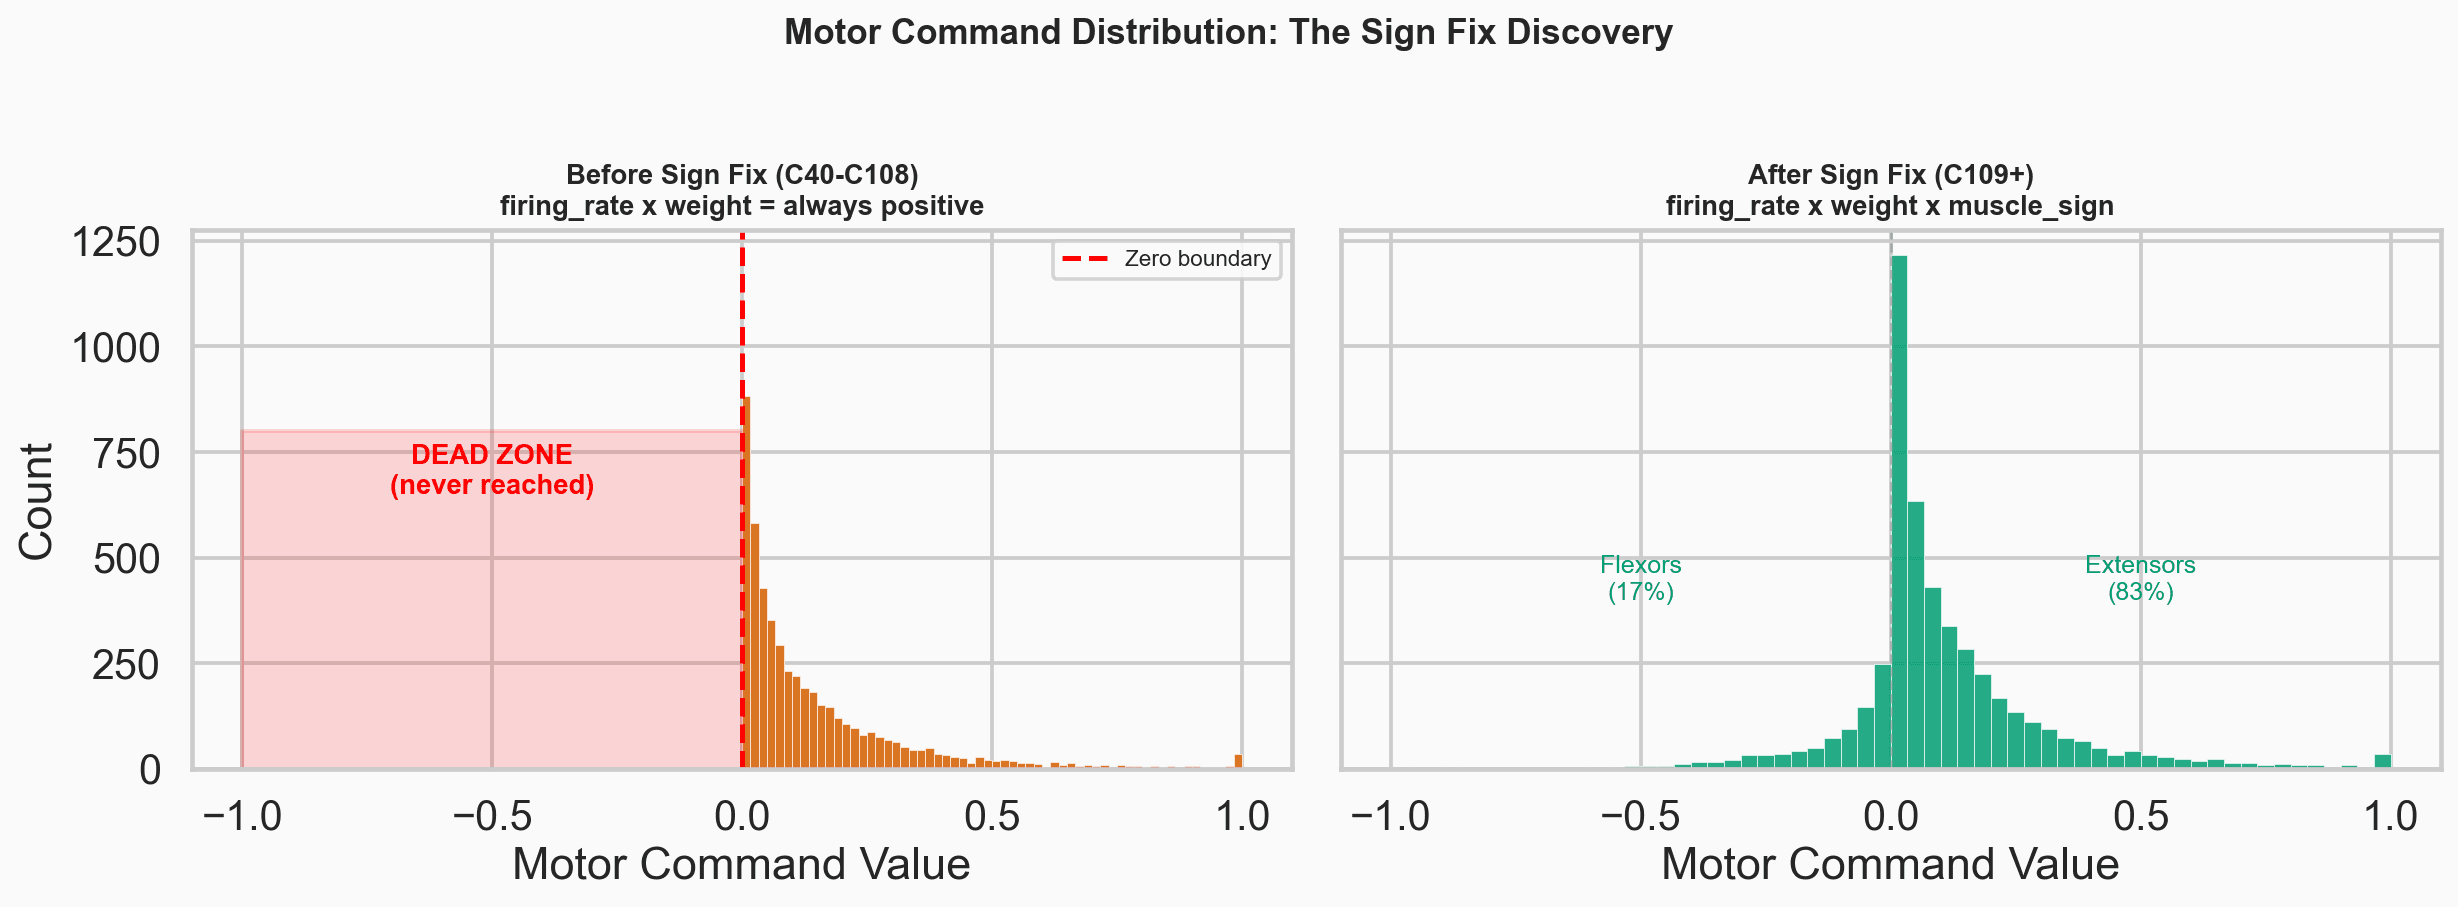
Era 1 · C40–C134Every joint in the fly has two kinds of muscles: extensors (straighten the joint) and flexors (bend it). Our motor commands were computed as firing_rate × weight, which is always positive.
- Extensors worked correctly (positive command = push outward)
- Flexors received positive commands too — they pushed outward instead of inward
- The fly could extend its legs but never properly retract them
- Only half the actuator range [0, +1] was used; [−1, 0] was dead
- 1,353 experiments (C40–C108) ran with this bug
The fix added a muscle_sign derived from MANC anatomy (+1 for extensors, −1 for flexors). Commands now span the full range [−1, +1].
Aggregate metrics can lie — enter JTF
Era 1 · C40–C134At cycle C106, WQS hit 5/8 — apparent progress. But video told a different story.
- The fly's belly sat flat on the ground
- Legs were curled upward, not supporting the body
- Forward motion came from friction, not stepping
- All five passing metrics measured oscillation dynamics (frequency, regularity) — achievable without lifting the body at all
This happened twice (C106 and C128). We added kinematic metrics to WQS — body elevation, foot contact, leg posture — expanding it from 8 to 11 and later to 13 metrics.
But the deeper problem remained: WQS is an aggregate measure with 13 binary checks. Many different configurations can score 8/13 — the RL reference scores 12/13, so anything between 8 and 12 is a vast space. Two flies scoring 8/13 can look completely different.

Breaking the speed ceiling: premotor modules
Era 1 · C40–C134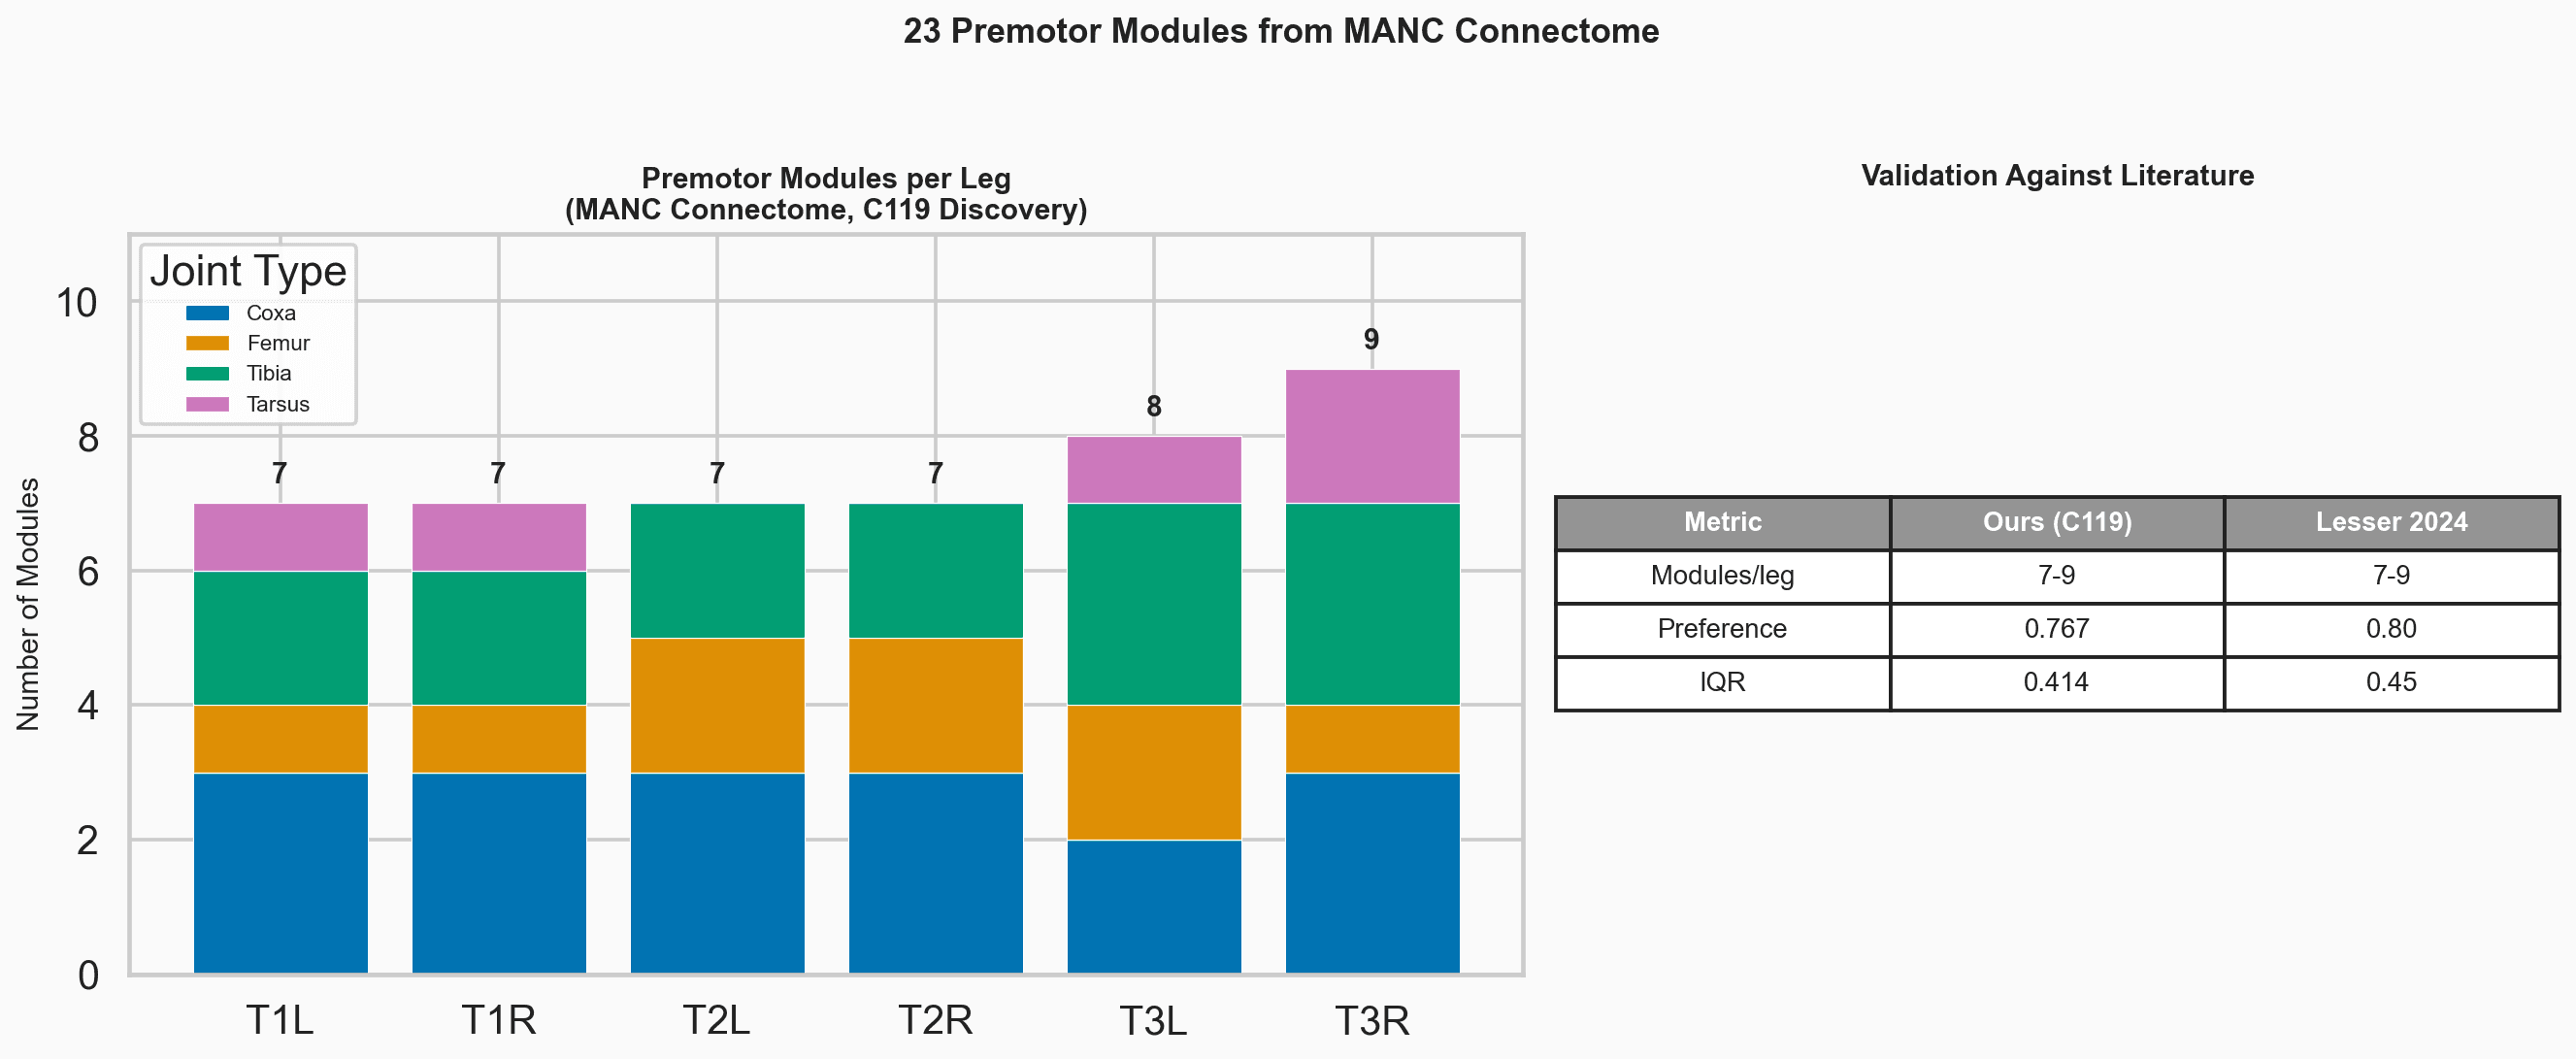
Initially, the CPG sent only two signals (E1 excitatory, I1 inhibitory) directly to all 48 leg joints. This was a proof of concept to test whether the basic CPG oscillation could produce any movement at all — and it did, but forward speed was capped at 0.37 cm/s.
That speed ceiling taught us the problem: two signals controlling 48 joints is like trying to play a piano with two fingers — 96% of timing information is lost.
We then analyzed the MANC connectome and found 6,466 intermediate (premotor) neurons between the CPG and the muscles. These cluster into 7–9 functional modules per leg, each targeting a specific joint and muscle type.
Inserting this module layer — using real MANC connection weights, not trained parameters — broke the ceiling: speed jumped to 2.65 cm/s (a 7× improvement), WQS from 6/11 to 7/11.
Era 1 final state: 3,559 experiments
Era 1 · C40–C134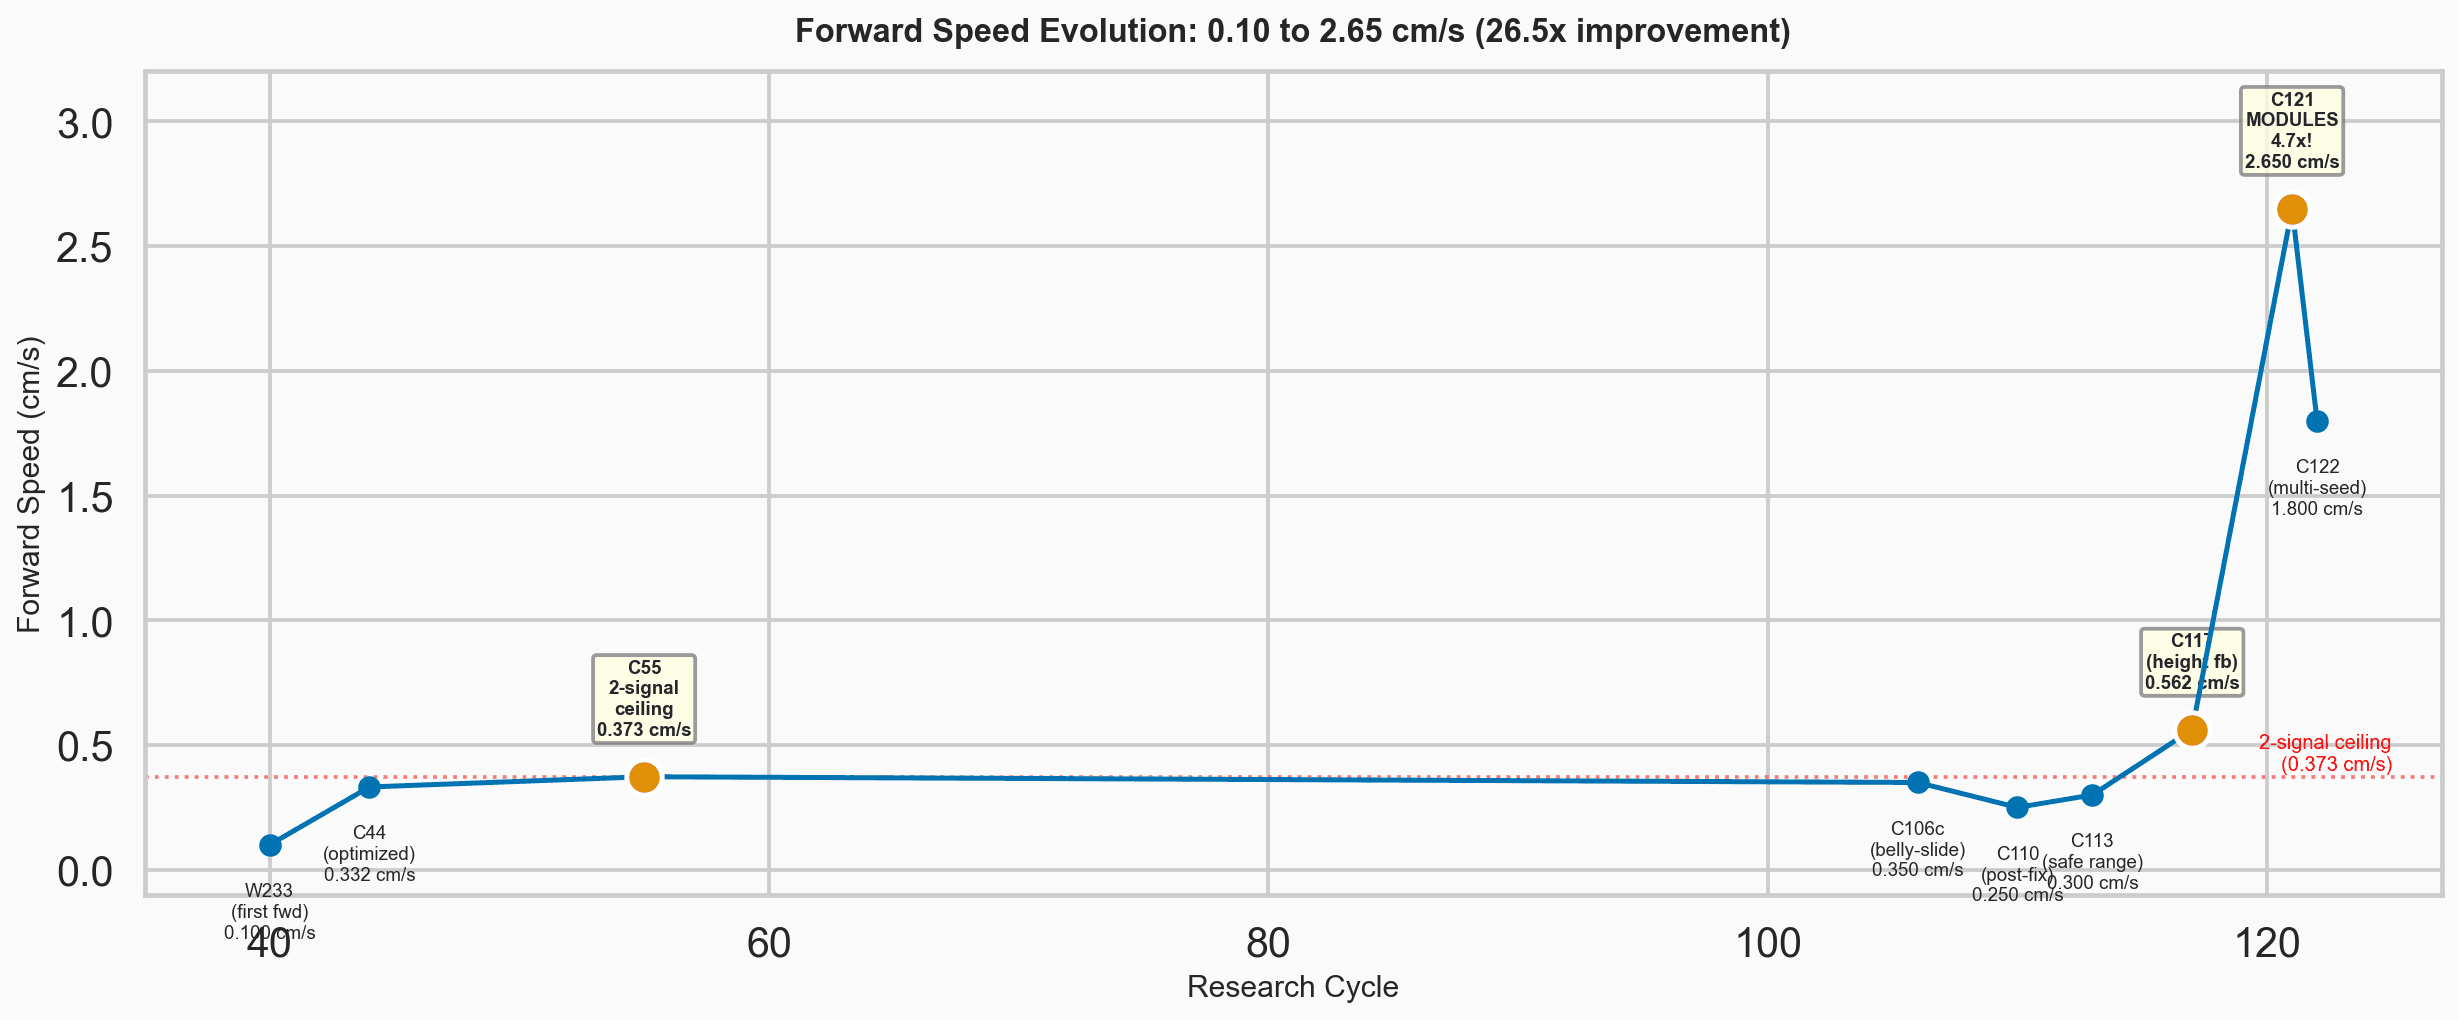
Era 1 champion: C131 sel_a1.5
| WQS v2 (best single seed) | 10/13 |
| WQS v2 (multi-seed mean) | 8.4/13, 5/5 seeds pass |
| JTF (per-joint fidelity) | ~0 (uncorrelated) |
| Forward speed | 2.65 cm/s |
| Body elevation | 0.808× (RL: 1.033×) |
Coordinated leg movement with forward locomotion. But body elevation 0.808× means the body is still on or near the ground — not standing on its legs. And JTF ~0 means the individual joint trajectories bear no resemblance to real walking, despite the aggregate WQS looking reasonable.
Dead classes
95 approaches tried and ruled out: signal processing, CPG parameter tuning, per-joint interventions, module-level modifications. Each is a rigorous negative result. Six distinct ceilings hit and broken through.
What didn't work: 95 dead classes
Era 1 · C40–C134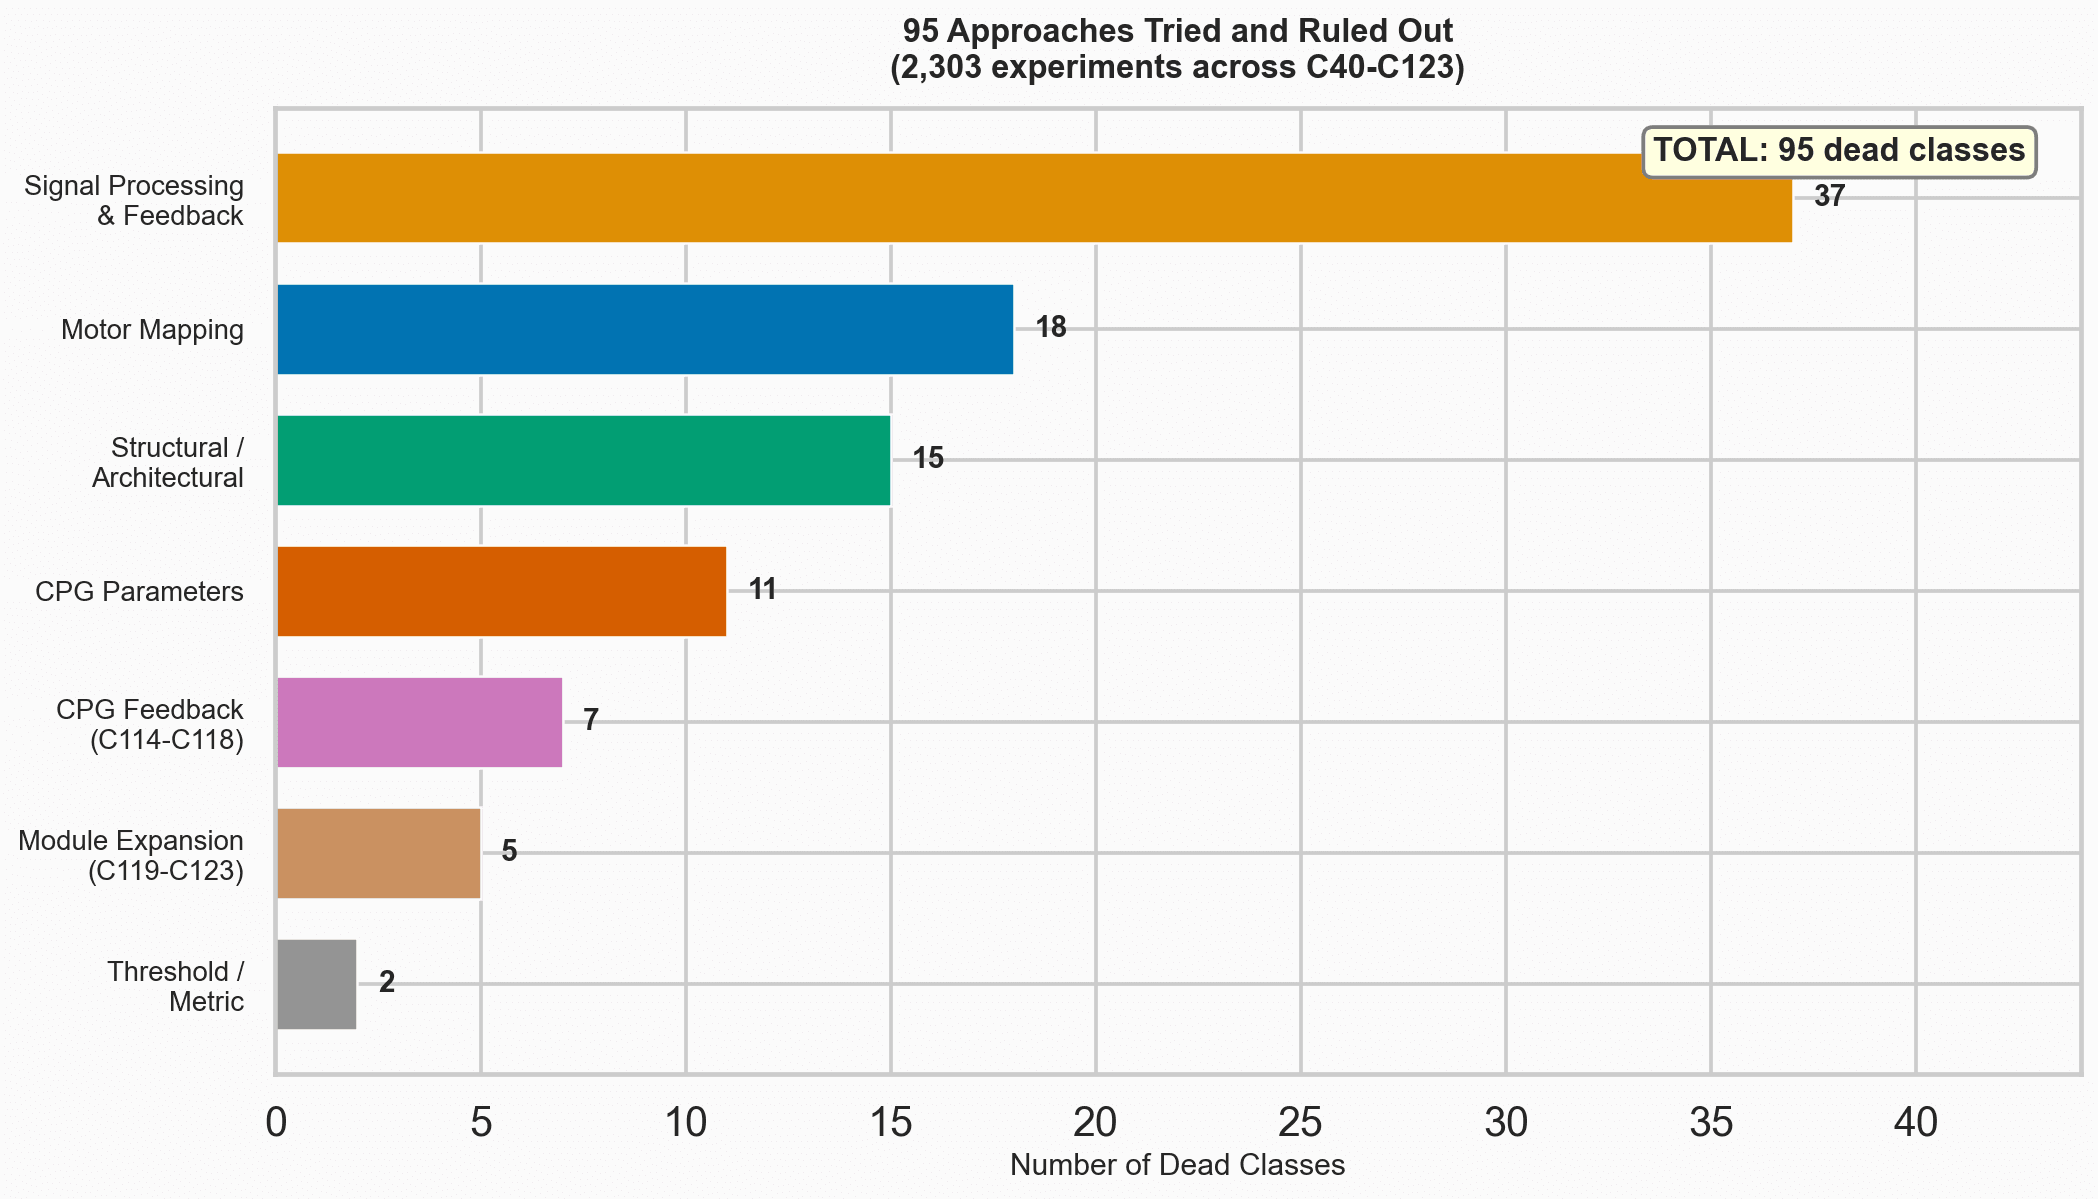
A "dead class" is an approach that was thoroughly tested and proven ineffective. These are not random failures — each represents tens to hundreds of experiments systematically exploring a hypothesis. Categories include motor mapping strategies, CPG parameter ranges, feedback mechanisms, module architectures, and signal processing methods.
By C150: 170+ dead classes across 7,388 experiments. Each is a rigorously documented negative result.
An important caveat: the simplified neuron model
Era 1 · C40–C134All 3,559 Era 1 experiments used a simplified neuron model: instead of simulating individual spikes, each neuron's activity was computed as a smooth curve using a tanh function in numpy. This is faster but less biologically accurate.
Concerns
- No individual spikes — no spike timing, no synaptic kinetics
- Connectivity loaded ad hoc, not through the validated framework
- No automated golden test protection
- "Bottlenecks" identified in Era 1 might be artifacts
C135 validation
- Ported the champion to Brian2 spiking neurons (LIF with adaptation)
- CPG neuron output correlation: 0.999998
- WQS 8.2 (spiking) vs 8.4 (rate) — comparable
The key discovery: CPG neurons don't generate rhythm
Era 2 · C135–C136C136: circuit reunification
We expanded the simulation from 48 CPG neurons to 1,848 neurons — including all premotor and motor neurons — running through the validated build_mixed_network() framework.
The walking rhythm we saw in Era 1 was actually created by sensory feedback: when the legs touch the ground, joint angles change, and that information cycles back through the circuit, creating a rhythmic pattern. The rate model's smooth tanh function had masked this distinction — because tanh smoothly transforms any input (including feedback-driven oscillation) into a smooth output wave, it was impossible to tell whether the oscillation originated inside the CPG or came from the feedback loop. Spiking neurons made the difference visible: no feedback input, no oscillation.
This was the turning point for H1 versus H2.
Results
| Neurons simulated | 1,848 |
| SVD rank | 3 → 7 |
| WQS | [8, 7, 7, 7, 7] mean = 7.2 |
| Gate | 5/5 seeds pass |
SVD (singular value decomposition) rank measures how many independent temporal patterns exist in the motor output — how many different rhythms the system is producing simultaneously. Rank 3 means all 48 joints were basically playing three patterns; rank 7 means seven distinct patterns, so the expanded circuit produces richer, more diverse motor commands.
Implication for the hypotheses
- H1 (CPG generates rhythm): weakened. The CPG neurons cannot oscillate alone.
- H2 (feedback creates rhythm): confirmed. Rhythm emerges from the closed loop.
Replacing heuristics with real connectome data
Era 3 · C137–C147The problem: proxies
The walking pipeline used several "proxy" rules — hand-written heuristics that approximate what real biological pathways would do. The MANC connectome contains 4,556 sensory neurons with recorded synaptic connections. We can replace proxies with actual connectome pathways.
C137: the first proxy replaced
The "self-targets" heuristic — a rule that said "when a leg is in stance, reinforce the CPG's current phase" — was replaced by real MANC intermediate neurons: IN01A012 and IN14A002. These were chosen because they are the neurons that campaniform sensilla (load-sensing organs in the fly's legs) actually connect to in the MANC wiring diagram.
C138: the universal routing principle
Tested all three types of sensory neuron in the MANC.
| Type | Count | Function |
|---|---|---|
| SNta (campaniform) | 2,494 | Load / ground contact |
| SNch (chordotonal) | 1,138 | Joint velocity |
| SNpp (proprioceptive) | 924 | Joint position |
The routing principle held for all three types: signals through intermediate neurons work; bypassing them disrupts locomotion.
Inter-leg coordination: an open question
We found zero direct (one-hop) synaptic connections between leg motor circuits in the MANC. This does not rule out multi-hop pathways — signals routed through chains of interneurons or descending neurons — but it means any neural inter-leg coordination is at least indirect. The lack of direct connections is consistent with H3, but further investigation of multi-hop pathways is needed before concluding it is purely mechanical.
Further reading: Lesser et al. 2024; Lee et al. 2025; Mamiya et al. 2025.
Per-joint control: the UBG architecture
Era 3 · C137–C147The insect locomotion literature describes a "Unit Burst Generator" (UBG) architecture: each joint has its own local feedback loop, and these loops are coupled through proprioception, not hardwired neural connections (Büschges & Ache 2024). C139 implemented this with real MANC connectivity — 326 experiments, 151 intermediate neurons traced.
Results
| JTF (per-joint trajectory fidelity) | ~0 → 0.083 |
| WQS v2 | 7.0 mean, 5/5 gate |
| Motor neurons firing | 427 / 1,824 |
| Size principle (recruitment order) | 1.00 (perfect) |
| Remaining proxies | 1 (CROSS_INH only) |
JTF moved from ~0 to 0.083 — the first meaningful per-joint correlation with real fly walking in 4,210 experiments. Middle legs (T2) responded best; front legs (T1) are anti-correlated.
Reflex reversal, a key mechanism in the stick insect literature (Bässler 1986), was not needed — the MANC connectivity handles reflex sign autonomously through 68% inhibitory intermediates.
Per-tier asymmetry
| Leg tier | Coxa JTF | Status |
|---|---|---|
| T2 (middle) | +0.229 (L), +0.124 (R) | Best |
| T1 (front) | −0.198 (L), −0.010 (R) | Anti-correlated |
| T3 (hind) | +0.095 (L), +0.038 (R) | Weak positive |
Middle legs respond best. Front legs are actually moving opposite to the RL reference — a sign of incorrect wiring or missing descending input.
The DC offset problem
Every joint sits 20–60 degrees away from where the RL reference says it should be. The fly oscillates at roughly the right frequency but from completely wrong baseline positions.
C140: investigating the DC offset
Era 3 · C137–C147The 32.78-degree mean offset between connectome and RL joint positions: is it fixable?
Five phases, ~400 experiments
| Approach | Result |
|---|---|
| Shift sensory zero-points to RL means | No effect — the offset is motor-side |
| Change geometry corrections | Every change collapses locomotion |
| Re-tune feedback gains | Sharp optimum at 0.30, no improvement |
| Per-leg-tier gain tuning | All worse than uniform |
| Combination sweep | No combination beats baseline |
The fragility diagnostic
The champion's optimal gain (coxa_pos=0.30) has a hard cliff at 0.50 where locomotion collapses entirely. The viable window is narrow: 0.20–0.40.
C141: testing the operating point hypothesis
Era 3 · C137–C147H4: operating point determines basin width
If we correct the DC offset — shifting joints to where biology intends them — the narrow optimum should widen into a robust basin. The offset would be the root cause of the fragility.
The test (85 experiments)
Added per-joint constants to motor output that shifted joint baselines toward RL mean positions, then measured whether the viable gain range widened.
Result: H4 rejected
- DC offset successfully reduced: 33° → 7°
- But JTF never improved — offset correction is orthogonal to trajectory fidelity
- The basin did not widen with the corrected offset
The real bottleneck: waveform shape
Decomposing the JTF gap into components revealed:
| Component | Contribution to gap |
|---|---|
| Waveform shape | delta = 0.253 (largest) |
| Frequency mismatch | Connectome 121 Hz vs RL 5.9 Hz |
| Amplitude | Secondary |
| DC offset | Smallest (orthogonal) |
The connectome fly oscillates at 121 Hz — twenty times faster than the RL reference's 5.9 Hz. And the shape of each oscillation cycle is wrong: the connectome produces sharp, spiky waveforms where the RL reference has smooth, rounded trajectories.
C142: the neuromuscular transform
Era 3 · C137–C147The waveform shape problem
C141 identified waveform shape as the primary JTF bottleneck (delta = 0.253). The connectome produced sharp, spiky joint angle waveforms at 121 Hz. Real fly muscles are slow — they smooth neural spikes into gradual contractions (Hooper et al. 2009: 200–700 ms relaxation time constants).
C142 added per-DOF muscle dynamics: each degree of freedom gets its own time constant, reflecting how different muscles contract at different speeds. The key insight was a gradient by joint type.
| Joint | τ (ms) | Biological basis |
|---|---|---|
| Coxa (hip) | 63 | Large, slow postural muscles |
| Femur (thigh) | 42 | Medium load-bearing muscles |
| Tibia (shin) | 21 | Small, fast swing muscles |
Results: first positive JTF
| JTF | −0.075 → +0.042 |
| WQS v2 | 5.8, 5/5 gate |
| H5 (muscle filter) | Partial |
The gradient tau map produced the first positive JTF in project history (4,560 cumulative experiments). The muscle filter is a real biological mechanism, not a proxy — these time constants reflect actual Drosophila muscle physiology.
C144–C145: zero proxies, fully connectome-driven
Era 3 · C137–C147C144: both proxies eliminated
The walking pipeline had accumulated "proxy" rules — hand-written heuristics approximating biological pathways. C144 replaced the final two.
| Proxy | Replaced by | MANC source |
|---|---|---|
| CROSS_INH (inter-leg) | bCS top-10 interneurons | Phelps et al. 2021 |
| Height-dependent drive | IN01B001 snta pathway | Real MANC IDs |
JTF: +0.061. H7 (proxy elimination) confirmed. T3L island equalized. 241 experiments.
C145: coordination expansion
Extended bCS to the top-10 bilateral campaniform sensilla interneurons with IN01B001. JTF reached +0.081 — all six legs positive for the first time. 324 experiments.
The remaining problem
JTF +0.081 is positive but still far from 1.0. C143, C146 and C147 explored sub-window muscle dynamics, neural signal recovery, and actuator-space approaches — all dead classes.
A deeper question emerged: the fly was not standing.
- All experiments started by dropping the fly from z = 0.3 with adhesion
- The stance spring (alpha = 8) held it up mechanically
- But
init_qpos=0means all joints start at zero — the fly collapses immediately - We were optimizing locomotion from a collapse
The standing-first paradigm
Era 4a · C148–C157The decomposition
Walking is not one problem — it's three, in sequence.
- Stand — actively hold posture with legs underneath the body
- Step — transition from tonic (standing) to rhythmic (walking) via descending command
- Coordinate — shape the rhythm into a proper gait via sensory feedback and inter-leg coupling
Eras 1–3 tried to solve all three simultaneously. C148 went back to step 1.
C148 results: quiet standing (744 experiments)
| Seeds passing | 5/5 |
| Body elevation | 0.200 cm (58% above belly rest) |
| Height CV | 0.0005 (zero vibration) |
| Tarsi in contact | 4/6 (T1 structural limit) |
| DNp09 walking initiation | Validated via bridge interneurons |
The corpse problem
C148 achieved standing with motor_scale=0.0 — the neural network's output was multiplied by zero. A stance spring alone held the fly up.
This is a balanced corpse. It tells us the biomechanics can support standing, but nothing about whether the living connectome can maintain posture.
DNp09: the walking switch
Descending neuron DNp09 (MANC IDs 12926, 12955) — headless flies walk only when DNp09 is stimulated (Bidaye et al. 2020). C148 confirmed that DNp09 has zero direct CPG connections. It activates walking through bridge interneurons (IDs 11420, 12709, 12769).
C150: neural standing — the fly is alive
Era 4a · C148–C157Hodgkin–Huxley motor neurons
To make standing genuinely neural-driven, we replaced the 372 motor neurons with Hodgkin–Huxley models calibrated to Azevedo 2020 electrophysiology.
| MN type | V_rest | R_in | Behavior |
|---|---|---|---|
| Slow (124) | −48 mV | 700 MΩ | Tonic 8.2 Hz at rest |
| Intermediate (124) | −60 mV | 400 MΩ | Silent at rest |
| Fast (124) | −68 mV | 200 MΩ | Silent at rest |
The Azevedo experiment in silico
At t = 1500 ms we injected −2 nA into all slow motor neurons (hyperpolarization).
- Elevation dropped 0.006 cm during silencing
- Slow MN firing: 56 Hz → 0 Hz → recovery
- Fast MN control: no effect (correctly silent)
- 5/6 criteria pass — standing is genuinely neural-driven
This reproduces the key finding of Azevedo et al. 2020: silencing slow motor neurons collapses posture.
Champion configuration
| Neurons simulated | 2,341 |
| Neural contribution ratio | 83.1% |
| Stance spring (alpha) | 2.0 (supplementary, not primary) |
| Motor scale | 0.03 |
| Seeds passing | 5/5 |
| Basin configs passing | 20/20 (5/5 seeds each) |
| Body elevation | 0.193 cm |
| Height CV | 0.0005 |
| Tarsi in contact | 4.0/6 |
Size principle validated
Henneman's size principle (Henneman 1957) confirmed: at +0.2 nA excitation, slow MNs (56 Hz) recruit first, then intermediate (42 Hz), then fast (22 Hz). This is the correct recruitment order for graded force production.
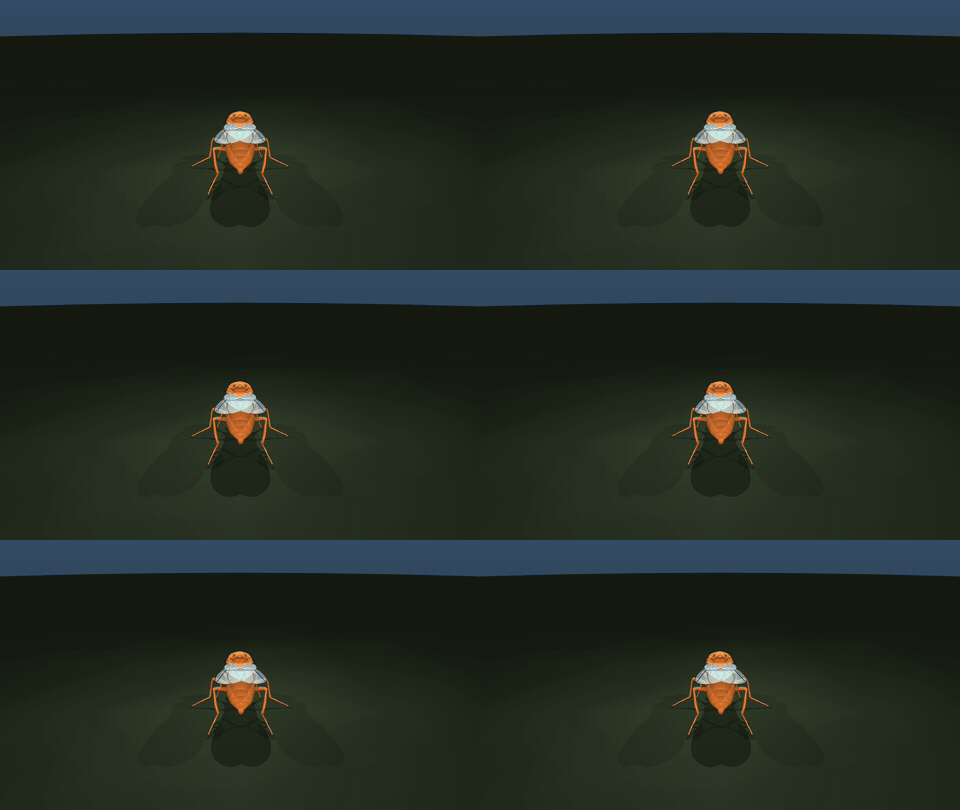
Per-muscle standing: Hill muscles and error-gated drive
Era 4b · C158–C173The approach
- Replaced whole-DOF torque scaling with a Hill-type muscle model (from FlyMimic / Özdil 2025)
- 15 per-leg muscles with calibrated F_max, optimal fiber length, pennation angle
- Error-gated activation: muscle drive = error × K_p, closing a biomechanical servo loop
- Best result: VLM 7.9 ± 0.25 (C173 P2a-4, HD multi-seed)
The alert: neural decoupling
- DC-278: error-gated drive completely bypassed neural output (byte-identical results across seeds)
- The Hill model was acting as a standalone controller — neural network contribution = 0%
- A VLM 7.9 fly that does not use its brain is not a neural fly
Key dead classes: DC-278 (neural decoupling), DC-279 (floor-only tarsi fix), DC-280 (± assignment conflicts).
Direct neural standing: per-muscle V_rest from MANC
Era 4c · C174–C181Per-muscle motor neuron mapping
- Mapped all 372 leg motor neurons from MANC to specific muscles and DOFs
- Classified each MN as slow / intermediate / fast (Azevedo 2020 size principle)
- Assigned V_rest per MN type: slow = −48 mV (tonic ~30 Hz), intermediate = −60 mV (silent), fast = −68 mV (high threshold)
- Anti-gravity classification: per-segment labeling of muscles as "anti" or "pro" gravity
- Anti-gravity MNs receive +I_ext boost (depolarize), pro-gravity get −I_ext (suppress)
Per-tier anti-boost
- T1 (front): ab = 0.97 — slight reduction (stable)
- T2 (middle): ab = 1.0 — standard drive
- T3 (hind): ab = 1.4 — extra boost (heavier segment)
ts_mult= 7.75× global torque scale (compensates the MuJoCo gear ratio)
The T3 classification flip: 66° in one line of code
Era 4c · C174–C181Discovery
The T3 (hind leg) sternal_anterior_rotator was classified as "pro-gravity" but actually performs an anti-gravity function in the posterior segments.
- Flipping one muscle classification changed T3 coxa abduction by 66°
- T3 coxa_abd: −51.6° (splayed at joint limit) → +14.4° (tucked under the body)
- But the full flip pushes the entire system into Basin H (pitch = −29.7°)
- A partial flip (
sternal_posterior_rotatoronly) preserves Basin L: pitch = −12.2°, hCV = 0.084
T3 splay: a PRNG artifact
The T3 splay (−51.6°) at joint limits is not a gain issue — it occurs at all T3ab values (1.0, 1.1, 1.2, 1.4).
- The per-tier code path changes T1 I_ext → different Brian2 PRNG consumption → T3 lands in the splay basin
- Uniform ab = 1.0 produces T3 coxa_abd = +14.4° (no splay)
- Same physics, same parameters, different only in PRNG sequence
Discovery: the Basin H/L bifurcation
Era 4c · C174–C181The two basins
| Metric | Basin L (good) | Basin H (bad) |
|---|---|---|
| Pitch | −4.8° to −12° | −29° to −47° |
| hCV | <0.2 (stable) | 0.1–7 (variable) |
| Elevation | −0.01 to −0.02 | +0.001 to +0.04 |
| Tarsi | 5–6/6 | 5–6/6 |
What flips the basin
- Warmup ramp (
wu_phase1 ≥ 0.2) → Basin H - Random seed (3/6 seeds Basin L, 1/6 Basin H)
- Code growth (adding unused parameters) → Basin H
- T3 classification flip → Basin H
Root cause: PRNG sensitivity
Brian2 uses random number generators during network construction (V_rest initialization, Poisson background). Any change to code execution order alters PRNG consumption.
- Adding a parameter declaration, even an unused one, consumes PRNG state
- Removing blank lines changes Python bytecode → different Brian2 code generation
- Result: identical physics parameters land in completely different behavioral basins
"The first millisecond is perfect" and the open-loop ceiling
Era 4c · C174–C181The insight
"The first millisecond of the video is perfect — if we could just keep it there."
The MuJoCo initial pose is the biological target. The neural circuit immediately drifts away from it. This reframes the problem.
- Standing is not about generating a posture
- Standing is about maintaining the posture that already exists at t = 0
- The missing ingredient: proprioceptive error correction
The open-loop ceiling
200+ experiments across C174–C181 systematically explored:
- Per-tier anti-boost (T1/T2/T3 independent)
- Warmup ramps (three decay schedules)
- Femur scale (0.5–2.0×)
- Joint damping (0–10 levels)
- T3 classification flips (full, partial, none)
- Trochanter boost (0–0.1 range)
All hit the same wall: pitch > −15° or elevation < 0 — never both simultaneously.
How the evidence changed our understanding
Synthesis| Era | H1: CPG generates rhythm | H2: feedback creates rhythm | H3: body mechanics |
|---|---|---|---|
| Era 1 — C40–C134 | Assumed primary. The rate model produced smooth oscillation. All CPG parameter tuning exhausted (441 configs). | Feedback mechanisms improved locomotion. Interpreted as "modulating" the CPG. | Geometry corrections doubled elevation (C131). |
| Era 2 — C135–C136 | Weakened. The spiking CPG cannot oscillate alone. | Confirmed. Rhythm comes entirely from the feedback loop. | Zero direct inter-leg connections in MANC. |
| Era 3 — C137–C147 | Revised to "tonic drive." Gain sets speed. | Strongest. Real MANC pathways work. Per-joint UBGs. Routing beats signal strength. | Both proxies eliminated (C144). bCS inter-leg interneurons found. Muscle dynamics load-bearing (C142). |
| Era 4a — C148–C157 | CPG provides an excitable substrate for standing and walking. | Rhythm will emerge when DNp09 shifts tonic → rhythmic. | Quantified. Passive stiffness <20% of standing force (C150 NCR = 0.831). |
| Era 4b — C158–C173 | Hill-type muscles bypass neural output (DC-278). Error-gated drive is a proxy. | SNta campaniform feedback creates walking at fg = 30 (H2 plus biomechanical loop). | Hill muscle F_max calibrated from FlyMimic. VLM 7.9 champion, but neural contribution ~0%. |
| Era 4c — C174–C181 | Per-muscle MN mapping from MANC. The size principle (slow/intermediate/fast) drives posture. | Open-loop ceiling. 200+ experiments: open-loop neural standing cannot reach VLM > 8. | Basin bifurcation discovered. PRNG sensitivity: seed, warmup and code changes flip the entire behavioral basin. |
Each row is one era; each column is one hypothesis as it stood at the end of that era.
H1′ — phase clock
Tonic drive only. Cannot oscillate.
H2 — confirmed
Feedback creates the rhythm.
H3 — quantified
Passive ~17%, neural ~83%.
H12 — confirmed
Hodgkin–Huxley motor neurons drive standing.
H13 — confirmed
An open-loop ceiling exists.
Also tested: H4 (DC offset) rejected. H5 (muscle filter) partial. H6 (sub-window) rejected. H7 (proxy elimination) confirmed. H8 (coordination) partial. H9–H11 mixed. H14 (per-muscle MN mapping improves standing) confirmed. H15 (anti-gravity classification) confirmed. 15 hypotheses tested, 187+ dead classes.
Where we are now
SynthesisWhat we've solved
| Component | Status | Cycle |
|---|---|---|
| Neural standing (open-loop) | Confirmed — 4/5 seeds Basin L | C181 |
| Per-muscle MN mapping | 372 MNs → per-DOF V_rest | C174 |
| Anti-gravity classification | Per-segment, per-tier boost | C174 |
| HH motor neurons (Azevedo) | Size principle preserved | C150 |
| Hill-type muscle model | Error-gated VLM 7.9 | C173 |
| Proxy count | Zero — C144 eliminated both | C144 |
| Basin bifurcation analysis | Root cause identified | C181 |
| Sensory routing principle | Universal | C137 |
Circuit: 5,198 neurons (48 AdEx CPG + premotor interneurons + 372 HH motor neurons). All MANC connections. Per-muscle motor output.
Next: proprioceptive feedback
200+ experiments hit the same wall: open-loop neural standing cannot exceed VLM ~8/10. The missing ingredient is proprioceptive feedback — the closed sensorimotor loop.
- SNpp angle feedback — 923 proprioceptive neurons, 639 with direct MN connections
- SNta load feedback — 2,493 campaniform neurons, 327× extensor bias
- SNch velocity feedback — 1,138 chordotonal neurons via 1,584 premotor interneurons
- Per-joint UBG closure — sensory routing creates per-DOF control loops
- Standing ↔ walking transition — DNp09 shifts tonic → rhythmic via the closed loop
The visual story
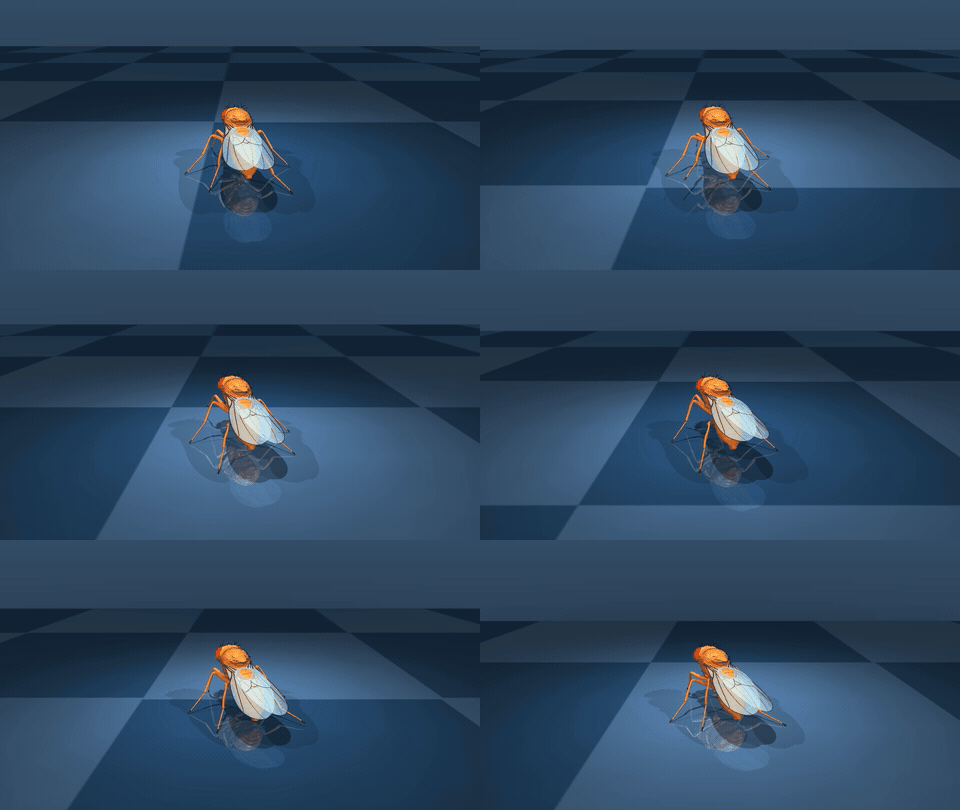
SynthesisFour renders, in research order, against the reference. Aggregate scores move; what the fly actually does moves less.
Reproducibility: key scripts and data
Synthesis| Purpose | Script / path | Era |
|---|---|---|
| Rate model walking (Era 1 champion) | scripts/cycle131_phase5_combined_stack.py | 1 |
| Rate-to-spiking validation | scripts/cycle135_framework_port.py | 2 |
| Circuit expansion (1,848 neurons) | scripts/cycle136_circuit_reunification.py | 2 |
| Real MANC sensory pathways | scripts/cycle137_*, cycle138_* | 3 |
| Per-joint UBG (C139 champion) | scripts/cycle139_* | 3 |
| DC offset investigation | scripts/cycle140_* | 3 |
| Operating point test (C141) | scripts/cycle141_* | 3 |
| Per-DOF muscle dynamics (C142) | scripts/cycle142_* | 3 |
| Proxy elimination (C144) | scripts/cycle144_* | 3 |
| Coordination expansion (C145) | scripts/cycle145_* | 3 |
| Standing-first (C148) | scripts/c148_* | 4a |
| Neural standing + HH MNs (C150) | scripts/c150_* | 4a |
| Standing video renders | scripts/standing/c150_render_neural_standing.py | 4a |
| Hill muscle standing (VLM 7.9) | experiments/c173_phase1c_hill_standing.py | 4b |
| Per-muscle neural standing | experiments/c174_phase1_per_muscle.py | 4c |
| Basin L champion (GOOD_BACKUP) | experiments/c174_phase1_per_muscle.GOOD_BACKUP.py | 4c |
| Consolidation deliverables | consolidation/*.json, *.md | — |
| WQS v2 scoring (13 metrics) | scripts/tools/cycle127_phase0_wqs_v2.py | — |
| RL kinematic reference | scripts/cycle124_rl_kinematic_reference.py | — |
| Video rendering | scripts/render_walking_video.py | — |
| Golden tests (verify framework) | python -m flybrian.tests.runner verify | — |
| RL reference joint profiles | flybrian/digifly/rl_reference/walking_forward_kinematics.npz | — |
| MANC synaptic connectivity | flybrian/data/unique_pairs_by_id_part[1-3].csv | — |
Literature grounding: 30+ papers
Synthesis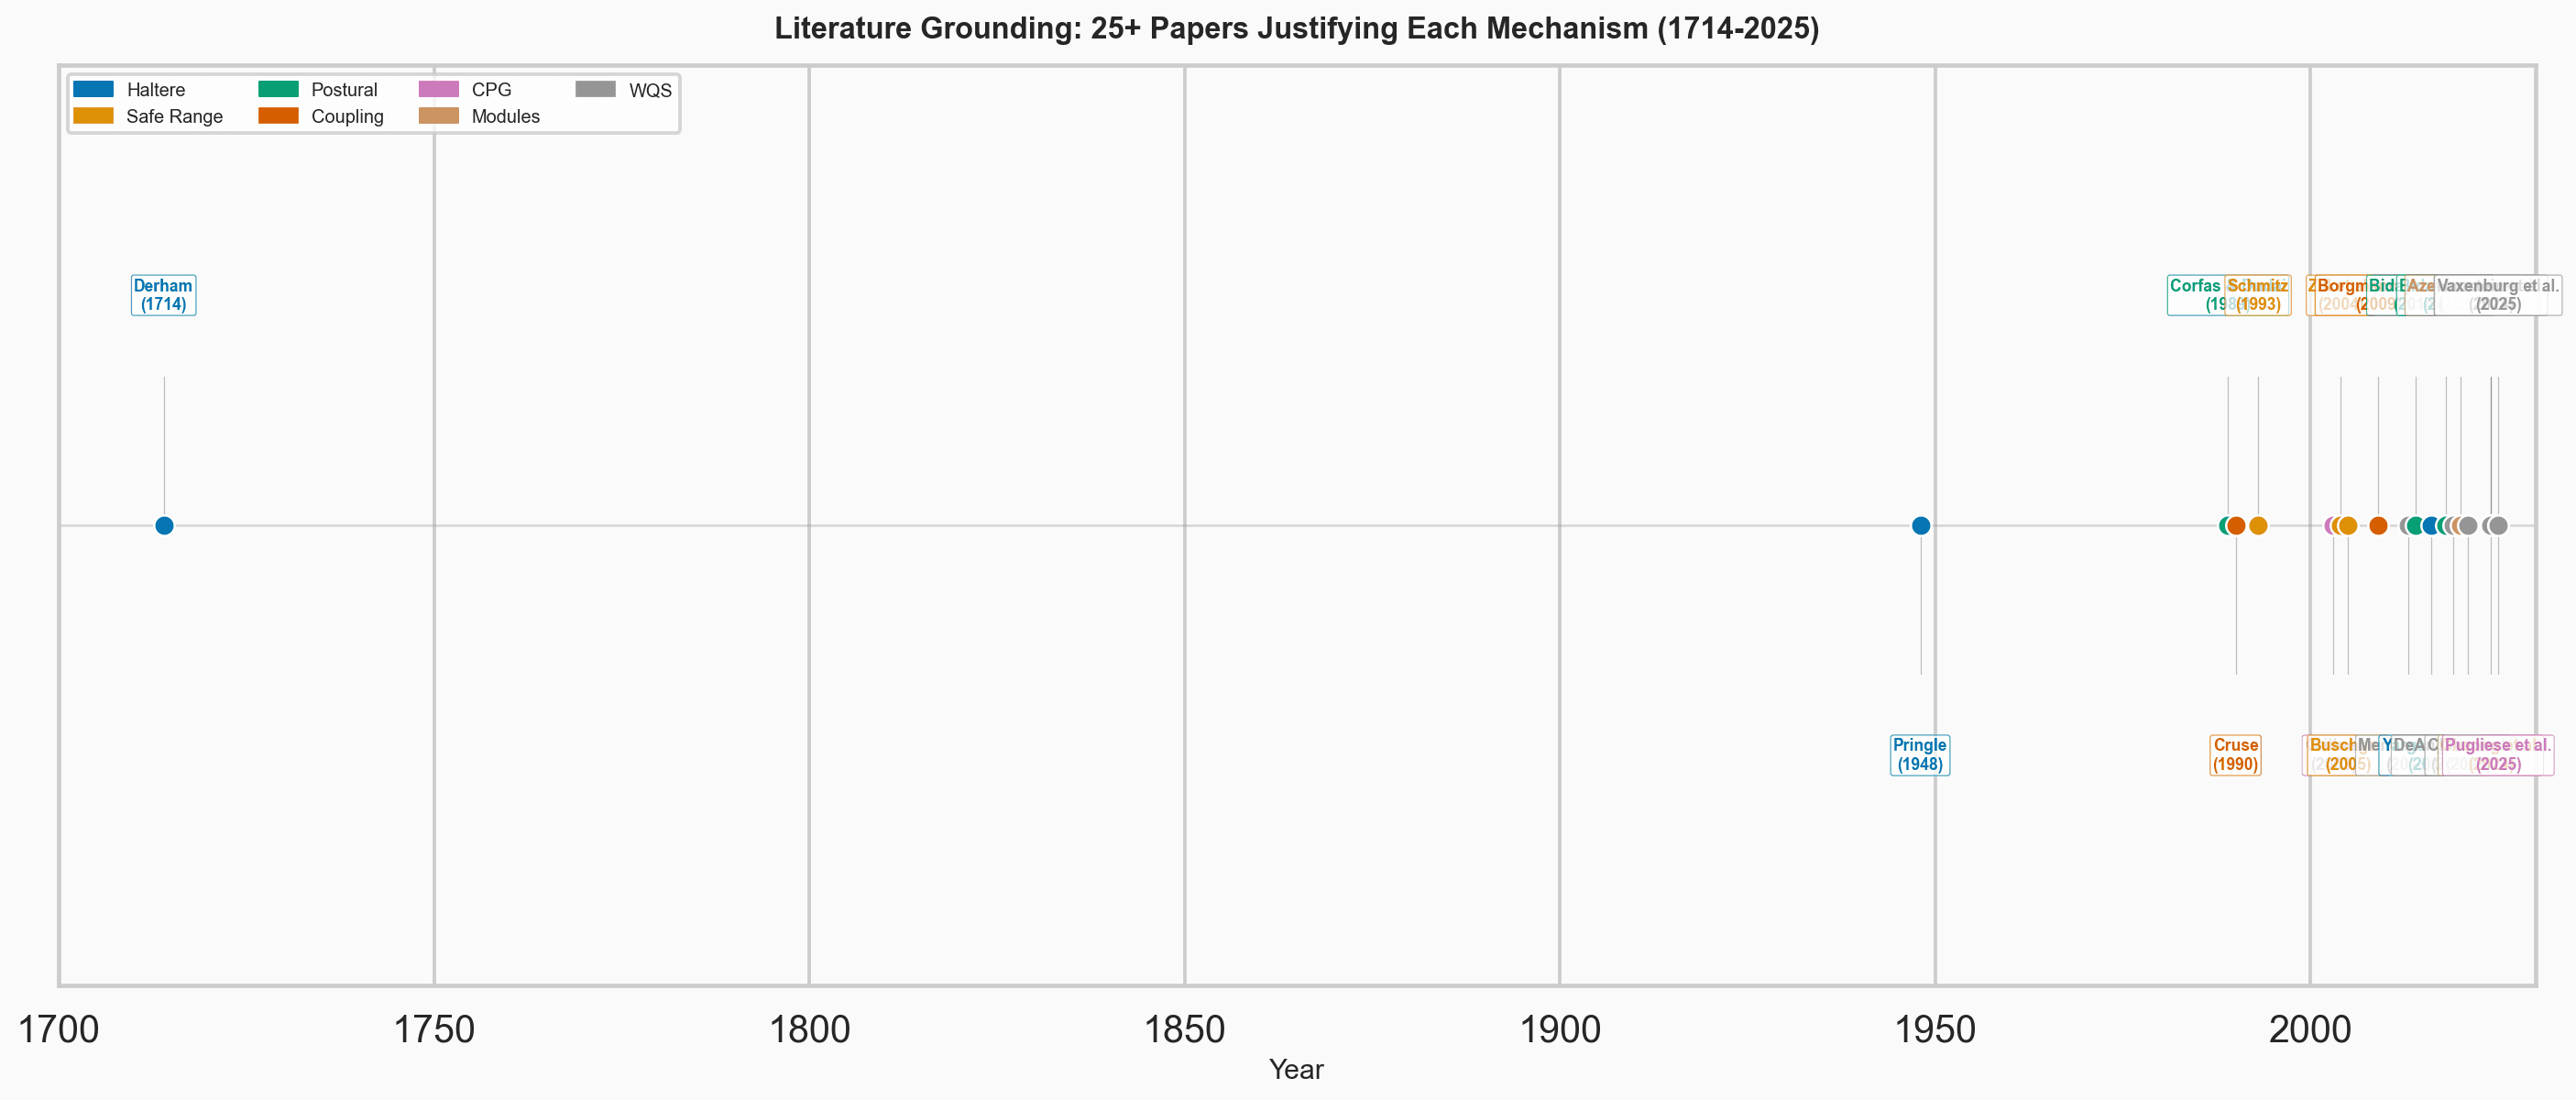
- Haltere reflex: Pringle 1948; Derham 1714; Dickinson 1999; Yarger & Fox 2016
- CPG / locomotion: Pearson 1993; Wilson 1961; Cruse 1990; Mendes et al. 2013
- UBG architecture: Bässler 1986; Bässler 1993; Büschges 2005; Büschges & Ache 2024
- Connectome / MANC: Takemura et al. 2024; Lesser et al. 2024; Azevedo et al. 2020
- Sensory pathways: Lee et al. 2025 (FeCO→13Bb); Mamiya et al. 2025 (CxHP8); Phelps et al. 2021 (bCS); Dallmann et al. 2025
- MN biophysics: Rohrbough & Broadie 2002 (E_glu); Allen et al. 2020 (scRNA-seq)
- RL reference: Vaxenburg et al. 2025; Pugliese et al. 2025
Summary
Synthesis| Total experiments | 10,800+ |
| Research cycles | 181 (C40–C181) plus 12 D3 phases |
| Dead classes (ruled-out approaches) | 187+ |
| Hypotheses tested | 15 (H1–H15) |
| Circuit size | 5,198 neurons (AdEx CPG + LIF premotor + 372 HH motor neurons, per-muscle mapped) |
| Motor neuron types | 3 HH classes (slow / intermediate / fast, Azevedo 2020) |
| Neural standing (open-loop) | 4/5 seeds Basin L — per-muscle MN mapping, per-tier anti-boost |
| Hill muscle standing | VLM 7.9 — but error-gated, neural contribution ~0% |
| Basin bifurcation | Discovered — PRNG sensitivity root cause identified |
| Remaining proxies | Zero (eliminated C144) |
| Open-loop ceiling | Confirmed — 200+ experiments hit the same wall |
| Literature grounding | 30+ papers (1714–2025) |
| Reinforcement learning used | Zero (RL is a reference target only) |